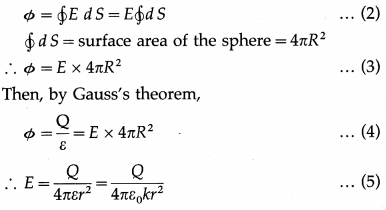
Balbharti Maharashtra State Board 12th Physics Important Questions Chapter 8 Electrostatics Important Questions and Answers.
Maharashtra State Board 12th Physics Important Questions Chapter 8 Electrostatics
Question 1.
State Gauss’s law in electrostatics.
Answer:
Gauss’s law: The net flux through a closed surface in free space is related to the net charge qenci that is enclosed by that surface and is given by
Φ = \(\oint \vec{E} \cdot \overrightarrow{d \mathrm{~s}}=\frac{q_{\mathrm{encl}}}{\varepsilon_{0}}\)
where e0 is the permittivity of free space and the electric flux \(\vec{E} \cdot \overrightarrow{d \mathrm{~s}}\) is integrated over the entire area of the surface.
[Note: The SI unit of electric flux is the newton metre squared per coulomb (N∙m2/C) or, equivalently, the voltmetre (V\vec{E} \cdot \overrightarrow{d \mathrm{~s}}m).]
Question 2.
A Gaussian surface in the form of a cube is centred on a point charge Q. What is the flux through one face of the cube?
Answer:
Since the point charge is at the centre of the cube, the electric flux through each face is the same. Therefore, the electric flux through one face is \(\frac{1}{6}\)th of the electric flux originating from or terminating at the point charge.
If ε is the permittivity of the medium, the electric flux through one face = \(\frac{Q}{6 \varepsilon}\).

Question 3.
An arbitrary surface encloses a dipole. What is the electric flux through this surface?
Answer:
Since the net charge enclosed by the surface is zero, the net electric flux through the surface is also zero. . v
Question 4.
Obtain an expression for the electric field intensity at a point outside a charged conducting spherical shell.
Hence, obtain an expression for the electric intensity (i) on the surface of (i.e., just outside) the spherical conductor (ii) inside the spherical conductor.
Answer:
Consider an isolated charged hollow spherical conductor A, of radius R and surface charge density σ, placed in a medium of permittivity ε. Consider a . point P outside the conductor at a distance r from its centre. To find the electric field intensity at P, we choose a spherical Gaussian surface S of radius r through P and concentric with conductor A. A small element of this surface containing P has an area dS.
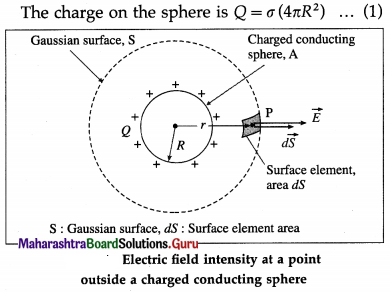
The charge Q is uniformly distributed over the outer surface of the spherical conductor. Then, by symmetry, the electric field intensity at every point on surface S is normal to the surface and has the same magnitude E. If charge Q is positive, \(\vec{E}\) at every point on S is radially outward.
The angle θ between \(\vec{E}\) and \(d \vec{S}\) being zero for every surface element, the electric flux through every element is
dΦ = \(\vec{E} \cdot d \vec{S}\) = E dS
Therefore, the flux through the Gaussian surface S is
where ε0 is the permittivity of free space and k = \(\frac{\varepsilon}{\varepsilon_{0}}\) is the relative permittivity (dielectric constant) of the surrounding medium.
∴ E = \(\frac{\sigma\left(4 \pi R^{2}\right)}{4 \pi \varepsilon r^{2}}=\frac{\sigma R^{2}}{\varepsilon r^{2}}\) …………… (6)
Equations (5) and (6) give the magnitude of the electric field intensity at a point P outside a hollow spherical conductor. If the net charge Q enclosed by the Gaussian surface is positive, \(\vec{E}\) is radially outward; if Q is negative, \(\vec{E}\) is radially inward. Equation (5) shows that for a point outside a hollow spherical conductor carrying a charge Q, the conductor behaves like a point charge Q at its centre.
Case (1) : At a point just outside the sphere, r ≅ R.
∴ E = \(\frac{\sigma}{\varepsilon}=\frac{\sigma}{k \varepsilon_{0}}\)
Case (2) : Since electric charge resides on the outer surface of a hollow conductor, the charge inside the hollow spherical conductor is zero. Then, Einside = 0.
[Notes : (1) The surface of a charged conductor is an equipotential surface so that the electric field just outside it must be normal to the surface of the conductor. For a spherical charged conductor, it follows that the field is radial, and because the net charge is, by symmetry, uniformly distributed over its outer surface, the field is spherically symmetric, the same as for a point charge.
(2) The electric field intensity is zero at all points inside a hollow charged conductor of arbitrary shape because under electrostatic condition the net charge of the charged conductor resides on its surface. This is also true for a hollow charged spherical conductor, if there is no charge in the cavity (e.g., on a conductor inside the cavity but insulated from the outer shell).]
Question 5.
Does the electric flux due to a point charge enclosed by a spherical Gaussian surface get affected when its radius is increased?
Answer:
No. Electric flux, or the number of electric field lines, passing through the Gaussian surface is independent of the size of the Gaussian surface and depends on the number of field lines originating from or terminating at the point charge, which in turn depends on the magnitude of the point charge and the permittivity of the medium.
Question 6.
Obtain an expression for the electric field intensity at a point outside an infinitely long charged cylindrical conductor.
Answer:
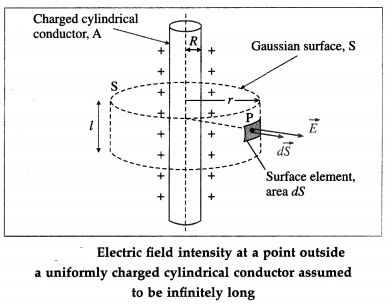
Consider an isolated cylindrical conductor A, of radius R and carrying a charge per unit length λ. We assume the conductor to be infinitely long. Consider a point P outside the conductor at a distance r from its axis. To find the electric field intensity at P, we choose a cylindrical Gaussian surface S of radius r through P and coaxial with the conductor A. As λ is the charge per unit length of conductor A, the net charge enclosed by the Gaussian cylinder of length l is
Q = λl ………….. (1)
A small element on the curved part of the Gaussian surface and containing P has an area dS.
Charge is uniformly distributed over the outer surface of the cylindrical conductor. Then, by symmetry, the electric field intensity at any point outside the conductor is perpendicular to the cylinder axis. Hence, the component of the electric field intensity perpendicular to the plane circular faces of the Gaussian surface is zero. Therefore, the electric flux through these flat faces is zero.
By symmetry, the electric field intensity \(\vec{E}\) at every point on the curved face of surface S is normal to the surface and has the same magnitude \(\vec{E}\). If the charge on conductor A is positive, E is directed along the outward drawn normal \(d \vec{S}\).
The angle θ between \(\vec{E}\) and \(d \vec{S}\) being zero for every surface element, the electric flux through every element is
dΦ = \(\vec{E} \cdot d \vec{S}\) = E dS
Therefore, the flux through the curved face of the Gaussian surface S is
Φ = \(\oint\) E dS = E \(\oint\) dS ……….. (2)
\(\oint\) dS = area of the curved surface = 2πrl, where l is the length of the cylinder as shown in the figure.
∴ Φ = E × 2πrl ………….. (3)
Then, by Gauss’s theorem,
Φ = \(\frac{Q}{\varepsilon}\) = E × 2πrl ……………. (4)
∴ E = \(\frac{\lambda l}{\varepsilon(2 \pi r l)}=\frac{\lambda}{2 \pi \varepsilon r}=\frac{\lambda}{2 \pi k \varepsilon_{0} r}\) ……………… (5)
where ε0 is the permittivity of free space and k = \(\frac{\varepsilon}{\varepsilon_{0}}\) is the relative permittivity (dielectric constant) of the surrounding medium.
This gives the magnitude of the electric field intensity in terms of the linear charge density λ. For positive λ, \(\vec{E}\) is outward, while for negative λ, \(\vec{E}\) is inward.
[Notes : (1) If σ is the surface charge density (charge per unit area), σ = \(\frac{\lambda l}{2 \pi R l}=\frac{\lambda}{2 \pi R}\) ∴ λ = 2πRσ
∴ E = \(\frac{2 \pi R \sigma}{2 \pi \varepsilon_{0} k r}=\frac{R \sigma}{\varepsilon_{0} k r}\) (2) If the charge on the conductor is negative, \(\vec{E}\) is inward.]
Question 7.
An infinitely long positively charged straight wire has a linear charge density λ. An electron is revolving around the wire as its centre with a constant speed in a circular plane perpendicular to the wire. Deduce the expression for its kinetic energy.
Answer:
Let r be the radius of the uniform circular motion of the electron. The electric field intensity \(\vec{E}\) at every point on the circular path is radially outward and has the same magnitude E = \(\frac{\lambda}{2 \pi \varepsilon r}\) .
∴ The centripetal force on the electron,
Fc = \(\frac{m_{\mathrm{e}} v^{2}}{r}\) = eE = \(\frac{e \lambda}{2 \pi \varepsilon r}\)
where me and v are the mass and linear speed of the electron.
∴ mev2 = \(\frac{e \lambda}{2 \pi \varepsilon}\)
∴ The kinetic energy of the electron,
\(\frac{1}{2}\) mev2 = \(\frac{e \lambda}{4 \pi \varepsilon}\)
Question 8.
Obtain an expression for the electric field intensity at a point outside a uniformly charged thin infinite plane sheet.
Answer:
Consider a thin, flat, infinite, positively charged conducting sheet, with a uniform surface charge density σ. let the permittivity of the surrounding medium be ε. The charge density has a planar symmetry, i.e., it appears the same from all points on a plane parallel to the sheet. Then, by symmetry, the electric field intensity \(\vec{E}\) (1) is perpendicular to the sheet (in this case, outwards) at all points outside the sheet, and (2) has the same magnitude E at any given distance on either side of the sheet.
To find E at a point P outside the sheet, imagine a Gaussian surface in the form of a small closed cylinder. Its axis is perpendicular to the sheet, with the point P on one end face, shown in below figure. The cylinder encloses a small area dS of the sheet. So, the charge enclosed by the cylinder = σdS …………. (1)
The flux through one end = EdS
∴ The flux through the Gaussian surface,
Φ = 2EdS …………… (2)
By Gauss’s theorem,
εΦ = net charge enclosed
∴ ε(2EdS) = σdS …………. (3)
∴ E = \(\frac{\sigma}{2 \varepsilon}=\frac{\sigma}{2 k \varepsilon_{0}}\) …………. (4)
where ε0 is the permittivity of free space and k = \(\frac{\varepsilon}{\varepsilon_{0}}\) is the relative permittivity (dielectric constant) of the surrounding medium.
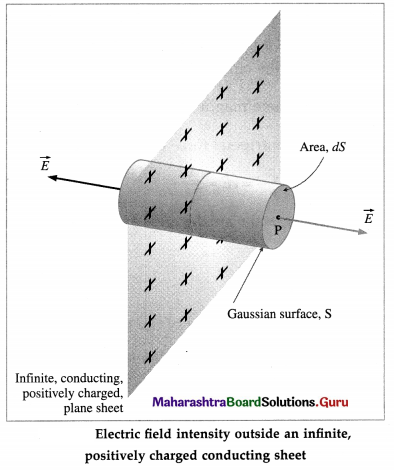
Equation (4) shows that the magnitude of the electric field intensity outside the charged sheet is uniform and independent of the distance from the sheet.
[Notes : (1) The electric field lines are straight, parallel to each other, and perpendicular to the sheet. (2) If the sheet is negatively charged, \(\vec{E}\) on either side of the sheet is directed towards the sheet.]
9. Solve the following
Question 1.
Two metal spheres, of radii 2 cm and 1 cm with respective charge densities 5 mC/m2 and -2 mC/m2, are inside a hypothetical closed surface in vacuum. What is the net electric flux through the surface ?
Solution:
Data : σ1 = 5 × 10⁻⁶ C / m2,
σ2 = -2 × 10⁻⁶ C/m2, r1 = 2 × 10⁻² m, r2 = 2 × 10⁻² m
ε0 = 8.85 × 10⁻¹² F/m
Surface charge density, σ = \(\frac{Q}{A}=\frac{Q}{4 \pi r^{2}}\)
∴ The charges on the metal spheres are
Q1 = σ1 (4πr12) and Q2 = σ2(4πr22)
∴ Net charge enclosed, Q = Q1 + Q2 = 4π(σ1r12 + σ2r22) = Q1 + Q2
= 4π[(5 × 10⁻⁶)(2 × 10⁻²)2 +(- 2 × 10⁻⁶)(10-2)2]
= 4π[(5 × 10⁻⁶)(4 × 10⁻⁴) + (- 2 × 10⁻⁶)(10-4)]
= 4π(10-10)(20 – 2) = 72π × 10-10 C
∴ By Gauss’s theorem, the net flux through the surface
= \(\frac{Q}{\varepsilon_{0}}=\frac{72 \times 3.142 \times 10^{-10}}{8.85 \times 10^{-12}}\) = 2.556 × 10³ V∙m or N∙m2/C
Question 2.
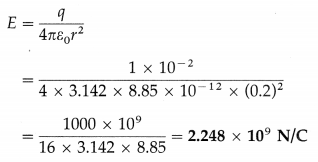
A hollow metal ball 10 cm in diameter is given a charge of 1 × 10⁻² C. What is the magnitude of the electric field intensity at a point 20 cm from the centre of the ball ?
Solution:
Data : D = 10 cm, R = \(\frac{D}{2}\) = 5 cm, q = 1 × 10⁻² C,
r = 20cm = 0.2 m, ε0 = 8.85 × 10⁻¹²
Electric field intensity,
Question 3.
The electric field intensity at a point 1 m from the centre of a charged sphere of radius 25 cm in air is 104 N/C. Find the surface charge density of the sphere.
Solution:
Data : r = 1 m,R = 0.25 m, E = 104 N/C, ε0 = 8.85 × 10⁻¹² F/m
E = \(\frac{\sigma R^{2}}{\varepsilon r^{2}}\)
As the sphere is situated in air, ε ≅ ε0.
∴ The surface charge density,
σ = ε0E(\(\frac{r}{R}\))2
= (8.85 × 10⁻¹²)(104)(\(\frac{1}{0.25}\))2
= 1.416 × 10⁻¹⁰ C/m2
Question 4.
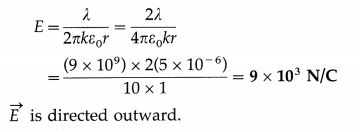
A long cylindrical conductor of radius 2 cm carries a charge of 5 μC/m and is kept in a medium of dielectric constant 10. Find the electric field intensity at a point 1 m from the axis of the cylinder.
[\(\frac{1}{4 \pi \varepsilon_{0}}\) = 9 × 10⁹ \(\frac{\mathbf{N} \cdot \mathbf{m}^{2}}{\mathrm{C}^{2}}\)]
Solution :
Data : R = 2 cm, λ = 5 × 10⁻⁶ C/m, k = 10,
r = 1 m, \(\frac{1}{4 \pi \varepsilon_{0}}\) = 9 × 10⁹ N∙m2/C2
Electric field intensity,
Question 5.
The electric field intensity at a point on the surface of a long, charged cylinder in air is 100 V/m. Find the surface charge density on the cylinder.
Solution:
Data: E = 100 V/m, ε0 = 8.85 × 10⁻¹² C2/N∙m2,
k = 1 (for air)
Let σ be the surface charge density on the cylinder.
E = \(\frac{\sigma}{\varepsilon_{0} k}\) :. σ = Eε0k
= 100 × 8.85 × 10-2 × 1
= 8.85 × 10⁻¹⁰ C/m2
Question 10.
Obtain an expression for the electric potential energy of a system of two isolated point charges.
Answer:
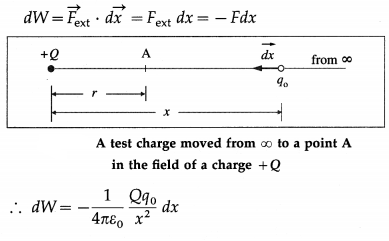
Consider a test charge q0 in the electric field \(\vec{E}\) of a source charge + Q. The electric force acting on the test charge, q0\(\vec{E}\), is a conservative force. When the test charge is moved in the field at constant velocity by some external agent, the work done by the field on the charge is equal to the negative of the work done by the external agent causing the displacement. Suppose an external agent moves the test charge without acceleration from a point B, at a distance r1 from + Q, up to a point A, at a distance r, shown in below figure.
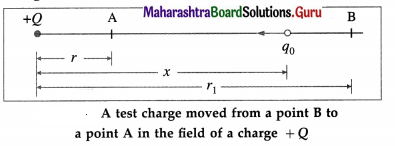
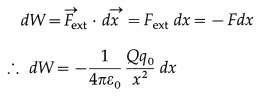
Since the electric field surrounding a point charge is not uniform, the electrostatic force on q0 increases as it approaches Q. Consequently, the external agent has to exert on q0 a force of increasing magnitude and, for equal displacements, do increasing amount of work. Because the force exerted varies along the path, we imagine the total displacement to be made up of a large number of infinitesimal displacements \(d \vec{x}\). The distance dx is so small that, at an average distance x from Q, the electrostatic force \(\vec{F}\) on q0 has a constant magnitude
F = \(\frac{1}{4 \pi \varepsilon_{0}} \frac{Q q_{0}}{x^{2}}\)
over the distance dx. The force \(\vec{F}_{\mathrm{ext}}\) by the external agent is equal and opposite to \(\vec{F}\) at every instant : \(\vec{F}_{\text {ext }}=-\vec{F}\)
Therefore, the infinitesimal work dW done by the external agent for the displacement \(\overrightarrow{d x}\) is
The total work done by the external agent in moving the test charge from A up to B is the line intergral of dW between the limits x = r1 and x = r.
where ∆U = UA – UB is the change in the potential energy of the test charge in moving it from the point B to the point A. Choosing the potential energy of q0 to be zero when it is infinitely far away from Q, i.e., r1 = ∞, its potential energy at a distance r from Q is
U(r) = \(\frac{1}{4 \pi \varepsilon_{0}} \frac{Q q_{0}}{r}\)
Thus, the potential energy of a system of two point charges q1 and q2, a distance r apart is
U(r) = \(\frac{1}{4 \pi \varepsilon_{0}} \frac{q_{1} q_{2}}{r}\)
[Note Taking U(∞) = 0 is often a convenient reference level in electrostatics, but in circuit analysis other reference levels are often more convenient.]
Question 11.
Explain the concept of electric potential difference and electric potential.
Answer:
A charge in an electric field possesses electric potential energy just as a particle in a gravitational field possesses gravitational potential energy. Consider a test charge q0 in an electric field, moved very slowly by an external agent from point B where its electric potential energy is UB to a point A where its electric potential energy is UA.
The change in the potential energy, UA – UB is defined as the work WB → A that must be done by an external agent to move the test charge from B to A against the electric force, keeping the charge always in equilibrium, i.-e., without accelerating the charge so as not to give it any kinetic energy.
WB → A = ∆U = UA – UB
The potential difference ∆V = VAB = VA – VB between two points A and B in electric field is
∆V = \(\frac{W_{\mathrm{B} \rightarrow \mathrm{A}}}{q_{0}}=\frac{\Delta U}{q_{0}}\)
Definition : The electric potential difference between two points in an electric field is defined as the work done per unit charge by an external agent against the electric force in moving an infinitesimal positive charge from one point to the other without acceleration.
We choose the potential energy UB and potential VB to be zero when the initial point B is infinitely far from the source charges which produce the field. Then, the work done per unit test charge by an external agent in bringing a test charge from infinity to a point is the electric potential at that point.
The electric potential at a distance r from a source charge,
V(r) = \(\frac{W_{\infty \rightarrow r}}{q_{0}}=\frac{U(r)}{q_{0}}\)
Definition : The electric potential V at a point in an electric field is defined as the work per unit charge that must be done by an external agent against the electric force to move without acceleration a sufficiently small positive test charge from infinity to the point of interest.
[Note : It is more correct to speak about potential difference ∆V between two points than just the potential V at a given point because the latter implies a choice of .zero reference potential. The choice is one of convenience and we may choose the zero reference potential for a point at infinity or at some other location convenient for the problem as is done for gravitational potential.]
Question 12.
State the SI unit and one non-SI unit of potential energy.
Answer:
SI unit of energy : the joule (J)
Non-SI unit of energy : the electronvolt (eV).
In electrostatics, one joule is the change in electric potential energy when a charge of one coulomb is moved through a potential difference of 1 volt. Therefore, 1J = 1C × 1V, so that 1V = 1J/C.
Question 13.
State the dimensions and SI unit of electric potential difference.
Answer:
Dimensions : [V] = \(\frac{[W]}{\left[q_{0}\right]}=\frac{\left[\mathrm{ML}^{2} \mathrm{~T}^{-2}\right]}{[\mathrm{TI}]}\)
= [ML2T-3I-1]
SI unit : the volt (V) = the joule per coulomb (J/C).
Question 14.
If the work done in bringing a charge of 10-18 C from infinity to point P is 2 × 10-17 J, what is the electric potential at P?
Answer:
V = \(\frac{W}{q_{0}}=\frac{2 \times 10^{-17} \mathrm{~J}}{10^{-18} \mathrm{C}}\)
= 20 volts is the electric potential at P.
Question 15.
Explain and define the electronvolt.
OR
What is electronvolt?
Answer:
When an electric charge moves under the influence of an electric field, the work done by the field on the charge increases the kinetic energy of the charge as the electric force is a conservative force. Since the elementary charge e is widely encountered in atomic and nuclear physics, a convenient non-SI unit of energy used is the electronvolt.
Definition ; An electronvolt (symbol, eV) is the increase in the kinetic energy of a particle with a charge equal in magnitude to the elementary charge e when the particle is accelerated through a potential difference of one volt.
∆(KE) = qAV
where q is the charge and ∆V is the potential difference.
∴ 1 eV = e(1V)
= (1.602 × 10⁻¹⁹ C) (1 J/C)
= 1.602 × 10⁻¹⁹ J
[Notes : (1) SI prefixes are commonly used with the unit. Therefore, 1 keV = 103 eV = 1.602 × 10⁻¹⁶ J, 1 MeV = 106 eV = 1.602 × 10⁻¹³ J, etc. (2) In practice, it is not unusual to use the electronvolt as an energy unit in nonelectrical situations. For example, an air molecule at room temperature has a kinetic energy of about \(\frac{1}{40}\) eV, the electron mass is 511 keV / c02, and the proton mass is 938 MeV/c02, where c0 is the speed of light in free space.]
Question 16.
Obtain the relation between the magnitude of electric field intensity and electric potential.
Answer:
Consider a test charge q0 as it moves from point A to point B in an electric field. The electric force on q0 at any point along the path is
\(\vec{F}=q_{0} \vec{E}\)
where \(\vec{E}\) is the field at that point.
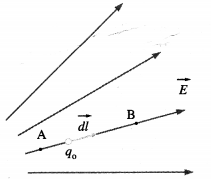
The incremental work dW done by the field as q0 undergoes a displacement \(\overrightarrow{d l}\) along the path is
dW = \(\vec{F} \cdot \overrightarrow{d l}\)
= q0 \(\vec{E} \cdot \overrightarrow{d l}\) = q0 E dl
In the process, the charge q0 is moved from a higher potential to a lower potential, thereby losing potential energy. Therefore, the change in potential energy
dU = -dW = -q0 Edl
By definition, the change in electric potential is dv
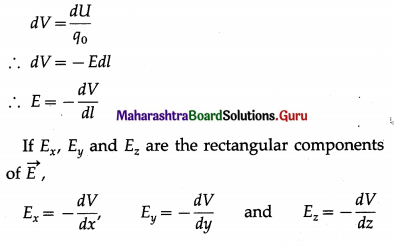
The quantity \(\frac{d V}{d l}\) is the rate at which the electric potential changes with distance and is called the electric potential gradient. The above equation thus shows that the magnitude of the electric field intensity at a point is equal to the negative of the potential gradient at that point.
[Note : (1) The negative sign shows that if we move in the direction of the electric field, the potential decreases. In the opposite direction, it increases. (2) If we draw equipotentials [see Unit 8.5] so that adjacent surfaces have equal potential differences, then in regions where the magnitude of \(\vec{E}\) is large, the equipotential surfaces are close together because the field does a relatively large amount of work on a test charge in a relatively small displacement. Conversely, in regions where the field s weaker, the equipotential surfaces are farther apart. (3) Potential gradient is an another name for electric field. (4) From the relation E = – dV/dx, we get another very common SI unit of electric field intensity, namely, the volt per metre (V/m).]
Question 17.
Define electric potential gradient.
Ans
Definition The rate of change of electric potential with distance in a specified direction is called the electric potential gradient in that direction.
Question 18.
Obtain an expression for the electric potential at a point due to an isolated point charge.
Answer:
Consider a point A at a distance r from a static point charge ± Q, as shown in below figure. To determine the electric potential at the point A (due to Q), imagine a test charge q0 being moved from infinity
up to the point A without acceleration. Because the electric field of a point charge is not uniform, the force exerted by Q on q0 increases as it approaches Q. We imagine the total displacement to be made up of a large number of infinitesimal displacements. \(\overrightarrow{d x}\). The distance dx is so small that, at an average distance x from Q, the electrostatic force \(\vec{F}\) on q0 has a constant magnitude
F = \(\frac{1}{4 \pi \varepsilon_{0}} \frac{Q q_{0}}{x^{2}}\)
over the distance dx. The force Fext by the external agent is equal and opposite to \(\vec{F}\) at every instant : \(\vec{F}_{\mathrm{ext}}=-\vec{F}\)
Therefore, the infinitesimal work dW done by the external agent for the displacement \(\overrightarrow{d x}\) is
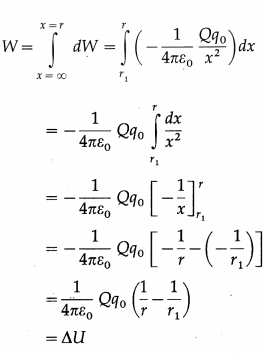
The total work done by the external agent in moving the test charge from infinity up to the point P (from x = ∞ to x = r) is the integral of dW between the limits x = ∞ and x = r.
W = \(\int_{x=\infty}^{x=r} d W=\int_{\infty}^{r}\left(-\frac{1}{4 \pi \varepsilon_{0}} \frac{Q q_{0}}{x^{2}}\right) d x\)

where ∆U = UA – UB is the change in the potential energy of the test charge in moving it from to the point A. Choosing the potential energy of q0 to be zero when it is infinitely far away from Q, its potential energy at a distance r from Q is
UA = \(\frac{1}{4 \pi \varepsilon_{0}} \frac{Q q_{0}}{r}\)
Therefore, the electric potential at a distance r from Q is
V = \(\frac{U_{\mathrm{A}}}{q_{0}}=\frac{1}{4 \pi \varepsilon_{0}} \frac{Q}{r}\)
The above equation also gives the electric potential either outside or on the external surface of a spherically symmetric charge distribution,
[Notes: (I) A positive charge produces a positive electric potential. A negative charge produces a negative electric potential. (2) A negative electric potential means a positive charge would be attracted from a larger distance, since the potential is lower (more negative) than at larger distances. Conversely, a negative charge would be repelled, as expected. (3) Only differences between potentials at two points are physically significant. Potential at a point is ambiguous unless we specify which is the reference point. (4) Electric potential, like electric field intensity, is independent of the magnitude of the test charge that we use to define it.]
Question 19.
What is the electric potential at 10 Å from a point charge 10-18 C in vacuum?
[\(\frac{1}{4 \pi \varepsilon_{0}}\) = 9 × 10⁹ N∙m2/C2]
Answer:
V = \(\frac{1}{4 \pi \varepsilon_{0}} \cdot \frac{Q}{r}\)
= \(\frac{9 \times 10^{9} \mathrm{~N} \cdot \mathrm{m}^{2} / \mathrm{C}^{2} \times 10^{-18} \mathrm{C}}{10 \times 10^{-10} \mathrm{~m}}\)
= 9 volts is the required electric potential.
Question 20.
Obtain an expression for the electric potential at a point due to several point charges.
Answer:
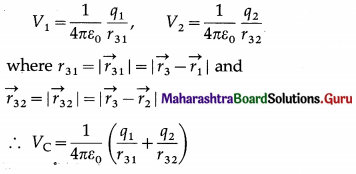
Consider a point P at distances r1, r2, r3, …, rN from point charges q1, q2, q3, ………, qN, respectively. The electric potentials of P due to the individual charges are
V1 = \(\frac{1}{4 \pi \varepsilon_{0}} \frac{q_{1}}{r_{1}}\) , V2 = \(\frac{1}{4 \pi \varepsilon_{0}} \frac{q_{2}}{r_{2}}\) …………. , VN = \(\frac{1}{4 \pi \varepsilon_{0}} \frac{q_{N}}{r_{N}}\)
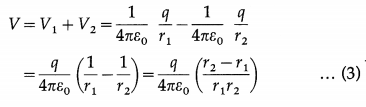
Since potential is a scalar quantity, the potential of P due to all the charges is the algebraic sum of the potentials due to the individual charges.
∴ V = V1 + V1 + ………. + VN
= \(\frac{1}{4 \pi \varepsilon_{0}}\left(\frac{q_{1}}{r_{1}}+\frac{q_{2}}{r_{2}}+\ldots+\frac{q_{N}}{r_{N}}\right)\)
= \(\frac{1}{4 \pi \varepsilon_{0}} \sum_{i=1}^{N} \frac{q_{i}}{r_{i}}\)
[Note : Electric potential is a scalar quantity. To calculate the resultant potential due to two or more point charges, the potentials due to individual charges are added as simple scalars along with its sign, determined by the sign of the q that produces V.]
Question 21.
Derive an expression for the electric potential at a point due to a short electric dipole. Hence, write the expression for the electric potential at a point
(i) on the dipole axis (ii) on the dipole equator.
OR
Derive an expression for the electric potential at a point due to an electric dipole.
Answer:
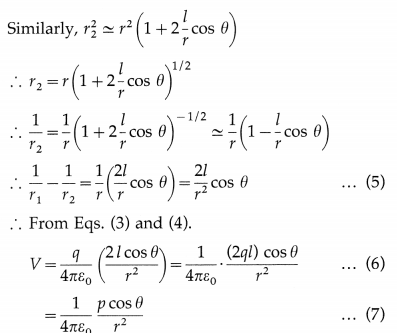
Consider an electric dipole AB of dipole length 21 and point charges + q and – q. Its electric dipole moment \(\vec{p}\) has magnitude p = 2ql. Let P be a point at a distance r from O, the centre of the dipole, in a direction θ with the dipole axis, as shown in below figure. Let AP = r1 and BP = r2.
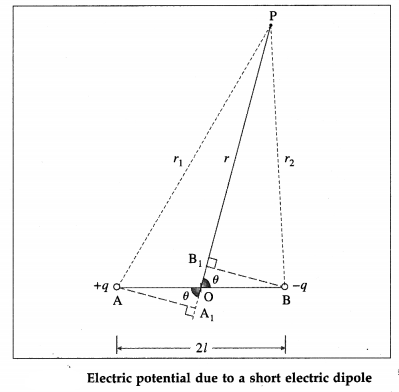
The electric potential at P due to the charge +q is
V1 = +\(+\frac{1}{4 \pi \varepsilon_{0}} \frac{q}{r_{1}}\) …………….. (1)
and that due to the charge -q is
V2 = \(-\frac{1}{4 \pi \varepsilon_{0}} \frac{q}{r_{2}}\) …………….. (2)
Method 1
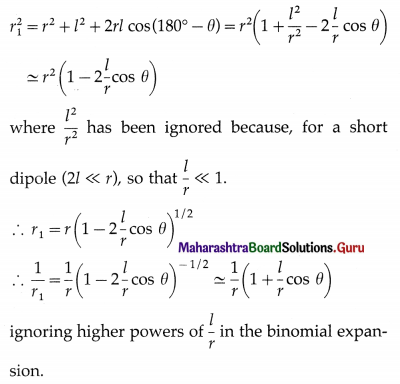
In the figure, PA1 = PA = r1 and PB1 = PB = r2.
For short dipole (2l << r), ∠OA1A ≅ ∠OB1B ≅ 90°.
Hence, in the right angled ∆s OA1A and OB1B,
OA1 = OB1 = l cos θ
∴ r2 – r1 = PA1 – PB1 = A1B1 = 2l cos θ
Also, r1r2 = PA1 × PB2 = (PO + OA1)(PO – OB1)
= (r + l cos θ)(r – l cos θ)
= l2 – l2 cos2 θ
= r2 (∵ l << r) …………… (4)
Method 2:
From △PAA1, by cosine rule,
This is the required expression.
Particular cases :
(i) At a point on the dipole axis, θ = 0° (nearer to the charge + q) or 180° (nearer to the charge – q).
∴ cos θ = ±1
∴ Vaxis = \(\pm \frac{1}{4 \pi \varepsilon_{0}} \cdot \frac{p}{r^{2}}\)
(ii) At a point on the dipole equator, θ = 90° or 270°.
∴ Cos θ = 0 ∴ Vequator = 0
[Note : Since Vequator = 0, the equatorial plane of a dipole is an equipotential plane of electric potential equal to zero. No work is required to move a charge anywhere in the equatorial plane.]
Question 22.
What is the electric potential at a point on the axis of a short electric dipole of moment 27 Cm if the point is at 0.5 m from the centre of the dipole and is located in vacuum? [\(\frac{1}{4 \pi \varepsilon_{0}}\) = 9 × 10⁹ N∙m2/C2]
Answer:
V = \(\pm \frac{1}{4 \pi \varepsilon_{0}} \cdot \frac{p}{r^{2}}\)
= \(\pm \frac{\left(9 \times 10^{9} \mathrm{~N} \cdot \mathrm{m}^{2} / \mathrm{C}^{2}\right)\left(10^{-27} \mathrm{C} \cdot \mathrm{m}\right)}{(0.5 \mathrm{~m})^{2}}\)
= ±3.6 × 10⁻¹⁷ V
is the required electric potential.
Question 23.
Distinguish between electric field intensity and electric potential.
Answer:
| Electric field intensity |
Electric potential |
| 1. Electric field intensity is a vector quantity associated with an electric field. |
1. Electric potential is a scalar quantity associated with an electric field. |
| 2. It is the electric force per unit positive charge placed at a point in an electric field. |
2. It is the work per unit charge which must be done by an external agent against the electric force to bring an infinitesimal positive charge from infinity to a given point in an electric field, without acceleration. |
| 3. Its SI unit is the newton per coulomb or the volt per metre. |
3. Its SI unit is the volt. |
Question 24.
Distinguish between the volt and the electron volt.
Answer:
| Volt |
Electronvolt |
| 1. The volt is the SI unit of electric potential (or poten-tial difference). |
1. The electronvolt is a non- SI unit of energy. |
| 2. If one joule per coulomb of work is done by an external agent against the electric force in moving an infini-tesimal charge from one point to another keeping the charge in equilibrium, the potential difference between the two points is called one volt. |
2. It is the increase in the kinetic energy of a particle carrying a charge equal to the elementary charge e when it is accelerated through a potential differ¬ence of one volt. |
| 3. 1 V = 1 J/C. |
3. 1 eV = 1.602 × 10⁻¹⁹ J. |
25. Solve the following
[Data : [\(\frac{1}{4 \pi \varepsilon_{0}}\) = 9 × 10⁹ N∙m2/C2]
Question 1.
A helium nucleus carries a charge of + 2e, where e is the elementary charge. Find the electric potential at 10-10 m from the helium nucleus.
[e = 1.6 × 10⁻¹⁹ C]
Solution:
Data : If q is the charge on helium nucleus,
q = +2e = 2 × 1.6 × 10-19 C,r = 10-10m,
1/4πε0 = 9 × 10⁹ N∙m2/C2
The electric potential,
V = \(\frac{1}{4 \pi \varepsilon_{0}} \frac{q}{r}\)
= \(\frac{2\left(9 \times 10^{9} \mathrm{~N} \cdot \mathrm{m}^{2} / \mathrm{C}^{2}\right)\left(1.6 \times 10^{-19} \mathrm{C}\right)}{10^{-10} \mathrm{~m}}\)
= 28.8V
Question 2.
Determine the electric potential at the midpoint of the line joining two charges 2 × 10⁻⁶ C and -1 × 10⁻⁶ C placed in vacuum 10cm apart.
Solution:
Data: q1 = 2 × 10⁻⁶ C, q2 = -1 × 10⁻⁶ C,
r = \(\frac{10 \mathrm{~cm}}{2}\) = 5cm = 0.05m,
1/4πε0 = 9 × 10⁹ N∙m2/C2
The electric potential at a distance r from a charge q is
V = \(\frac{q}{4 \pi \varepsilon_{0} r}\)
Since potential is a scalar quantity, the total electric potential at the midpoint is
V = V1 + V2 = \(\frac{1}{4 \pi \varepsilon_{0}}\) (q1 + q2)
= \(\frac{\left(9 \times 10^{9} \mathrm{~N} \cdot \mathrm{m}^{2} / \mathrm{C}^{2}\right)}{0.05 \mathrm{~m}}\) (2 – 1) × 10-6 C
= 1.8 × 10⁵ V
Question 3.
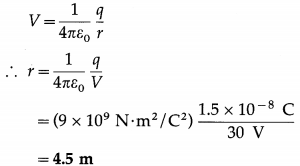
The electric field and electric potential at a certain point due to a point charge in vacuum are 9000 V/m and 18000 V, respectively. Find the distance of the point from the charge and the magnitude of the charge.
Solution:
Data: E = 9000 V/m, V = 18000 V,
1/4πε0 = 9 × 10⁹ N∙m2/C2
E = \(\frac{q}{4 \pi \varepsilon_{0} r^{2}}\), V = \(\frac{q}{4 \pi \varepsilon_{0} r}\)
\(\frac{V}{E}\) = r
∴ The distance, r = \(\frac{18000 \mathrm{~V}}{9000 \mathrm{~V} / \mathrm{m}}\) = 2 m
∴ The magnitude of the charge is
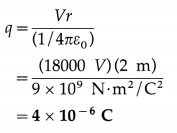
Question 4.
What is the electric potential at the centre of a square of side 1 m if point charges 1 × 10⁻⁸ C, -2 × 10⁻⁸ C, 3 × 10⁻⁸ C and 2 × 10⁻⁸ C are placed at the corners of the square?
Solution:
Data: q1 = 1 × 10⁻⁸ C, q2 = -2 × 10⁻⁸ C, q3 = 3 × 10⁻⁸ C, q4 = 2 × 10⁻⁸ C,
1/4πε0 = 9 × 10⁹ N∙m2/C2
The distance of the point of intersection O of the diagonals, from each charge is \(\sqrt {2}\) / 2 = 1/\(\sqrt {2}\) m.
∴ r = 1/\(\sqrt {2}\) m
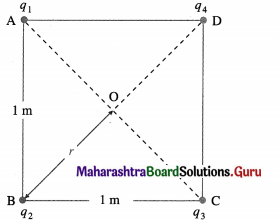
The potential at a distance r from a charge q is
V = \(\frac{1}{4 \pi \varepsilon_{0}} \frac{q}{r}\)
As potential is a scalar quantity, the total electric potential at O is
V = V1 + V2 + V3 + V4
= \(\frac{1}{4 \pi \varepsilon_{0} r}\) (q1 + Vq2 + q3 + q4)
= \(\frac{\left(9 \times 10^{9} \mathrm{~N} \cdot \mathrm{m}^{2} / \mathrm{C}^{2}\right)}{(1 / \sqrt{2} \mathrm{~m})}\) [(1 – 2 + 3 + 2) × 10-8 C]
= 360\(\sqrt {2}\) = 509.2 V
Question 5.
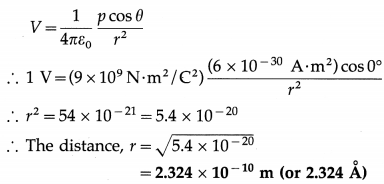
The electric potential due to a dipolar molecule of electric dipole moment 6 × 10-30 A∙m2 at a point along the axis of the dipole is 1 V. Find the distance of the point from the centre of the dipole.
Solution:
Data : p = 6 × 10-30 A∙m2, V = 1 V,
θ = 0° (axial point), 1/4πε0 = 9 × 10⁹ N∙m2/C2
Electric potential,
Question 6.
Two charged particles, carrying – 2 pC each, are held in place 10 cm apart. A point B is at distance of 18 cm from both.
(a) Calculate the electric potential at point B.
(b) A third charged particle, of mass 10-15 kg and carrying charge – 1 pC, is released from rest at point B. What is its speed when it is far from the two fixed charged particles?
Solution:
Data : q1 = q2 = q = – 2 × 10-12 C,
r1 = r2 = r = 18 cm = 0.18m,. q3 = – 1 × 10-12 C,
m3 = 10-15 kg
The electric potential at B,
VB = V1 + V2 = 2(\(\frac{1}{4 \pi \varepsilon_{0}} \frac{q}{r}\))
= 2(9 × 10⁹)(\(\frac{-2 \times 10^{-12}}{0.18}\)) = – 0.2 V
(b) By definition, the potential energy of an electric charge at infinity, i.e., far away from other charges, is U∞ = 0. To find the speed of the third charged particle at infinity, we use the principle of conservation of energy.
KB + UB = K∞ + U∞
where the KE of the particle at B, KB = 0, since it is released from rest. The PE,
UB = q3VB = (-1 × 10-12)(- 0.2) = 2 × 10-13 J
∴ The KE of the particle at infinity,
k∞ = \(\frac{1}{2}\) mv2 = UB = 2 × 10-13 J
∴ v = \(\sqrt{\frac{2 K_{\infty}}{m}}=\sqrt{\frac{2\left(2 \times 10^{-13}\right)}{10^{-15}}}\) = 20 m/s
This gives the required speed.
[Note: The PE of the third charge at Bis +2 × 10-13 J, while at inifinity it is zero. All of the initial electrical PE is converted to KE because of the positive work done on it by the repulsive field due to the other two charges. The negatively charged third particle gains kinetic energy when it moves from a lower-potential point to a higher- potential point, in this case from VB = – 0.2 V to V∞ = 0. Also note that the net force on the third negatively charged particle decreases as it moves away from point B. Its acceleration is not constant, so kinematical equations cannot be used to find its final speed. Hence, we have used the principle of conservation of energy.]
Question 7.
A proton is released from rest in vacuum in a uniform electric field of intensity 100 V/m. What is its speed after it has travelled a distance of 1 m ? [mp = 1.67 × 10⁻²⁷ kg, 1 eV = 1.6 × 10⁻¹⁹J]
Solution :
Data : u = 0 m/s, E = 100 V/m, l = 1 m, mp = 1.67 × 10⁻²⁷ kg, 1 eV = 1.6 × 10⁻¹⁹ C
In a uniform electric field \(\vec{E}\), the potential difference between two points a distance l apart (along \(\vec{E}\)) is
∆V = El = (100 V/m) (1 m) = 100 V
The change in the kinetic energy of the proton is
∆KE = eA V = e (100 V) = 100 eV
= 100 × 1.6 × 10-19
= 1.6 × 10⁻¹⁷ J
Since the proton starts from rest, the initial kinetic, energy is zero. Therefore, the change in kinetic energy equals the final kinetic energy \(\frac{1}{2}\) mpv2.
∴ \(\frac{1}{2}\) mpv2 = 1.6 × 10⁻¹⁷ J
∴ v2 = \(\frac{2\left(1.6 \times 10^{-17} \mathrm{~J}\right)}{1.67 \times 10^{-27} \mathrm{~kg}}\)
= 1.916 × 10¹⁰ (m/s)2
∴ v = 1.384 × 10⁵ m/s
The speed of the proton after it has travelled a distance of 1 m is 1.384 × 10⁵ m/s.
Question 8.
A particle carrying 5 electrons starts from rest and is accelerated through a potential difference of 8900 V. Calculate the KE acquired by it in MeV. [Charge on electron = 1.6 × 10⁻¹⁹ C]
Solution :
Data : q = 5e, u = 0, V = 8900 V, e = 1.6 × 10⁻¹⁹ C
q = 5(1.6 × 10⁻¹⁹ C) = 8 × 10-19 C
Initial KE = KEi = \(\frac{1}{2}\) mu2 = 0
∴ ∆KE = KEf – KEi = KEf
∆KE = qV
∴ The final KE, KEf = qV
= (8 × 10-19 C) (8900 V)
= 7.12 × 10⁻¹⁵ J
= \(\frac{7.12 \times 10^{-15}}{1.6 \times 10^{-19}} \mathrm{eV}\)
= 4.45 × 10⁴ eV
= (4.45 × 10-2) × 106 eV
= 4.45 × 10⁻² MeV
Question 9.
A proton is accelerated from rest through a potential difference of 500 volts. Find its final momentum. [mp = 1.67 × 10⁻²⁷ kg, e = 1.6 × 10⁻¹⁹ C]
Solution:
Data : mp = 1.67 × 10⁻²⁷ kg, e = 1.6 × 10⁻¹⁹ C, u = 0, V = 500 V
Initial KE, KE; = \(\frac{1}{2}\) mpu2 = 0
∴ ∆KE = KEf – KEi = KEf
∆KE = qV
∴ KEf = qV KEf = \(\frac{1}{2}\) mpv2 = \(\frac{p_{\mathrm{f}}^{2}}{2 m_{\mathrm{p}}}\)
where pf = mpv ≡ the magnitude of the final momentum of the proton.
∴ Pf2 = 2 mpqV
∴ Pf = \(\sqrt{2 m_{\mathrm{p}} q V}\)
= \(\sqrt{2\left(1.67 \times 10^{-27} \mathrm{~kg}\right)\left(1.6 \times 10^{-19} \mathrm{C}\right)(500 \mathrm{~V})}\)
= 5.169 × 10⁻²² kg∙m/s
The momentum is directed along the applied electric field.
Question 10.
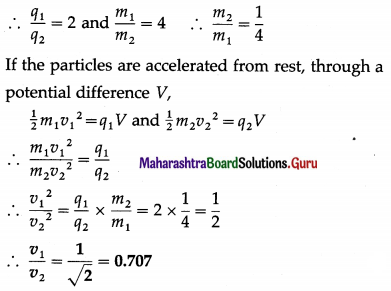
A proton and an α-particle are accelerated from rest through the same potential difference. Compare their final speeds. Charge on an α-particle = 2 × charge on a proton, mass of an α-particle = 4 × mass of a proton.
Solution:
Lution: Let q1 = charge on an α-partic1e, q2 = charge on a proton, m1 = mass of an α-particle, m2 = mass of a proton, v1 = final speed of the α-particle, v2 = final speed of the proton
Question 26.
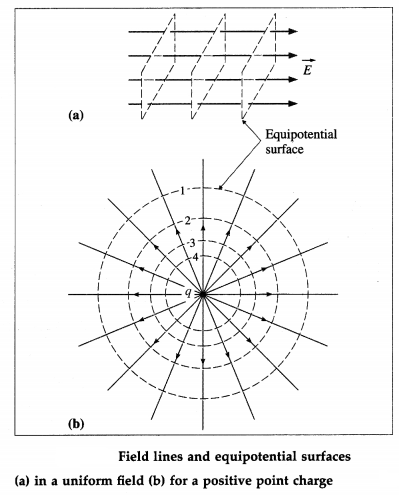
What do you mean by an equipotential surface? What is the shape of equipotential surfaces for the special case of (i) a uniform field (ii) a single point charge?
Answer:
An equipotential surface, in a region where an electric field is present, is a three-dimensional surface on which the electric potential is the same at every point.
Electric field lines and equipotential surfaces are always mutually perpendicular. In a diagram, only a few representative equipotentials are shown, usually with equal potential differences between adjacent surfaces. Also, equipotential surfaces for different potentials do not touch or intersect since a point cannot be at two electric potentials simultaneously.
For the special case of a uniform field, in which the field lines are equally-spaced parallel lines, the equipotentials are parallel planes perpendicular to the field lines, from figure (a).
For equal potential differences between adjacent planes, these equipotentials are equally spaced. For the special case of a single point charge, for which the field lines are radial, the equipotentials are concentric spheres centred on the point charge, from figure (b).
For a given point charge q.
V = \(\frac{C}{r}\)
where C = \(\frac{q}{4 \pi \varepsilon_{0}}\) is a constant. Since \(\frac{1}{r}\) is not a linear function of r, equipotentials with equal potential differences between adjacent surfaces are not evenly spaced in radius.
Question 27.
Electric field lines and equipotential surfaces are always mutually perpendicular. Explain.
Answer:
If a test charge q0 is moved on an equipotential surface of potential V, the electric potential energy U = q0V remains constant. Because U does not change as q0 is moved, the work done by the electric field on q0 must be zero. If \(\vec{E}\) is the electric field on the surface,
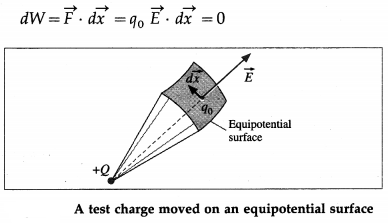
Hence, the electric force q0\(\vec{E}\) is always perpendicular to the displacement of a charge moving on an equilateral surface. Thus, electric field lines and equipotential surfaces are always mutually perpendicular.
Note that if \(\vec{E}\) is not perpendicular to a equipotential surface everywhere, it would have a component E|| along the surface, so that for a displacement dx between two points on the surface, the work done dW = E||dx ≠ 0. This would imply a potential difference between the two points which contradicts the definition of a equipotential surface.
Question 28.
Draw a diagram showing the equipotential surfaces and electric field lines in the plane of (i) an electric dipole (ii) a system of two equal positive charges.
Answer:
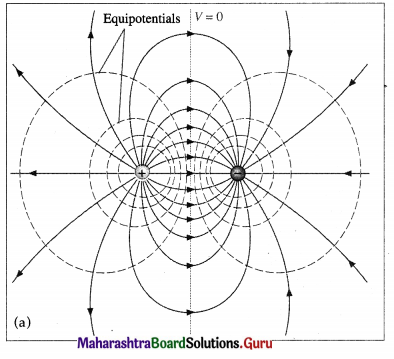
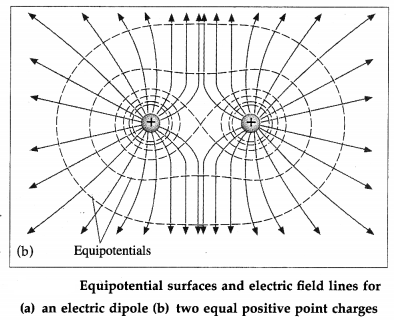
[Note: At each crossing of an equipotential and a field line, the two are perpendicular.]
Question 29.
What can you say about the direction of the electric field on the surface (just outside) of a charged conductor in an electrostatic situation?
Answer:
When all charges on a conductor are at rest, the tangential component of the electric field \(\vec{E}\) is zero at every point on the surface (just outside) of a conductor; otherwise, charges would move around on the surface. If follows that, in an electrostatic situation, the electric field just outside a conductor must be perpendicular to the surface at every point and a conducting surface is always an equipotential surface.
Question 30.
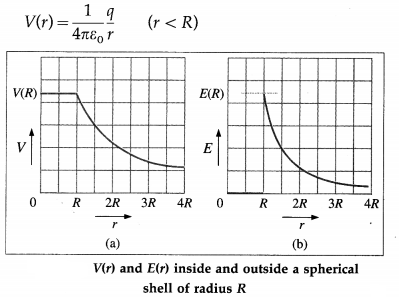
What are the electric potentials outside and inside a charged spherical conductor in electro static equilibrium?
Answer:
Consider a spherical conductor of radius R and static charge q. By Gauss’s law, the electric field due to the charged conducting sphere is
\(\vec{E}=\frac{1}{4 \pi \varepsilon_{0}} \frac{q}{r^{2}} \hat{r}\) (r ≥ R)
= 0 (r < R)
because for r < R, charge enclosed by a Gaussian surface inside the sphere is zero but in the region r ≥ R, outside, the charged sphere is identical to a point charge at the centre of the sphere.
Consequently, since V(r) = \(-\int \vec{E} \cdot \overrightarrow{d r}\), the electric potential outside the sphere must be the same as that of an isolated point charge q located a r = 0.
∴ V(r) = \(\frac{1}{4 \pi \varepsilon_{0}} \frac{q}{r}\) (r ≥ R)
Thus, a conducting sphere in electrostatic equilibrium is a spherical equipotential surface at potential V(R) and in the region r ≥ R, the equipotentials are concentric spheres.
Inside the sphere, r < R, E = 0, so V(r) is constant in this region. Since V(R) = q/4πε0R,
Question 31.
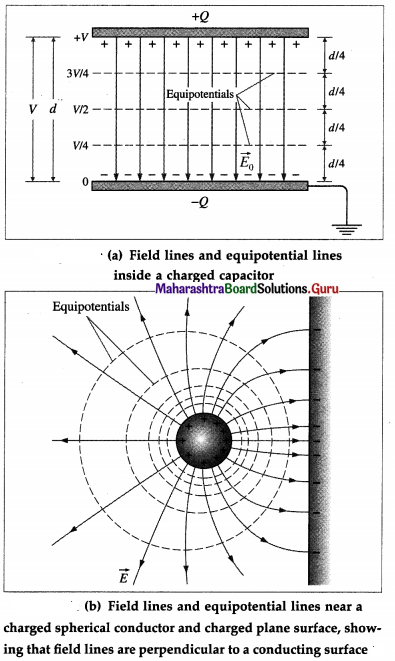
Draw diagrams showing the equipotential sur faces and electric field lines (a) within a charged parallel-plate capacitor (a pair of parallel metal plates with charges of equal magnitude and opposite sign)
OR
(b) if one of the plates of the capacitor is replaced by a charged spherical conductor.
Answer:
(a) A pair of charged parallel metal plates sets up a uniform electric field between the plates, away from its edges, as shown by their even spacing. The field is perpendicular to the plates, in the direction from the positive plate toward the negative plate. Conductors are equipotential surfaces, so the negative plate is an equipotential surface with potential taken as zero and the positive plate is an equipotential surface with potential = V. The equipotential surfaces between the plates are parallel to the plates. Electric field lines and equipotential surfaces are perpendicular to each other. Also, because the electric field is uniform between the plates, equipotential surfaces representing equal potential differences are equally spaced.
Question 32.
What are the advantages of using electrostatic potential?
Answer:
The electrostatic potential at each point in space in the vicinity of the source charges represents a scalar field.
The advantages of electrostatic potential field associated with a given distribution of charges are as follows:
- If we know the potential difference between any two points, we can easily obtain the change in potential energy and the work done when a charge placed in the field moves between these two points.
- Electric field is a vector field. Electrostatic potential being a scalar field, the potential at any point due to several charges is simply the algebraic sum of the potentials due to the individual charges.
- The construction of equipotential surfaces helps to visualize the electric field pattern.
- It is possible to calculate the electric field \(\vec{E}\) from the scalar potential field function V (by differentiating V with respect to the space coordinates.)
Question 33.
Derive an expression for the potential energy of a system of two point charges.
Answer:
The electric potential energy of a system of point charges at rest in free space is defined as the work done by an external agent against the electric force in assembling the charges by bringing them from infinity to their locations in the configuration, always keeping the charges in equilibrium.
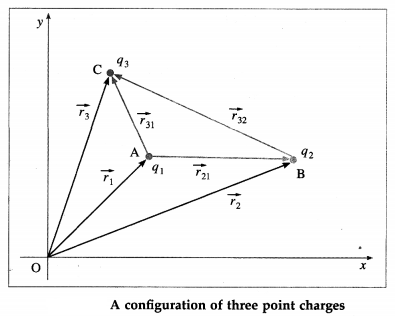
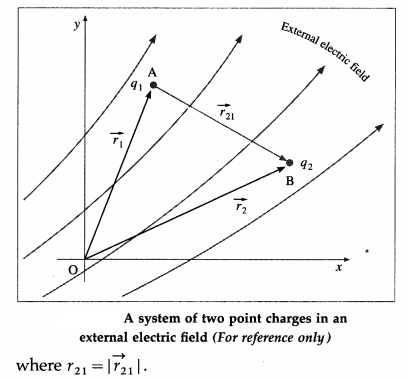
Consider assembling a system of two point charges q1 and q2 at points A and B, respectively, in a region free of external electric field. Let \(\vec{r}_{1}\) and \(\vec{r}_{2}\) be the position vectors of A and B, respectively,, with respect to an arbitrary reference frame.
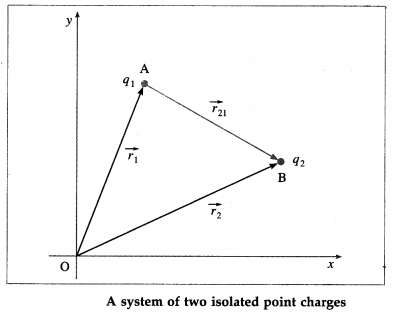
In the absence of charge q2, since there is no external electric field in the region, no work is done in bringing the first charge q1 from infinity to A, so W1 = 0. Subsequently, due to q1 the potential at B is
VB = \(\frac{1}{4 \pi \varepsilon_{0}} \frac{q_{1}}{r_{21}}\)
where r21 = \(\left|\vec{r}_{21}\right|, \vec{r}_{21}=\vec{r}_{2}-\vec{r}_{1}\) being the position vector of B with respect to A. Consequently, the work done by an external agent in bringing q2 from infinity to B in the electric field of q1 is
W2 = VB ∙ q2 = \(\frac{1}{4 \pi \varepsilon_{0}} \frac{q_{1} q_{2}}{r_{21}}\)
Hence, the total work done is
W = W1 + W2 = 0 + \(\frac{1}{4 \pi \varepsilon_{0}} \frac{q_{1} q_{2}}{r_{21}}\)
= \(\frac{1}{4 \pi \varepsilon_{0}} \frac{q_{1} q_{2}}{r_{21}}\)
Since the charges were always kept in equilibrium, the change in the potential energy Uf – Ui equals W.
Since the charges were brought from infinity where their potential energy is assumed to be zero, Ui = 0. Therefore, the potential energy of the system of two point charges is
U = Uf = \(\frac{1}{4 \pi \varepsilon_{0}} \frac{q_{1} q_{2}}{r_{21}}\)
Question 34.
A system consisting of a charged spherical shell and an electron has negative electric potential energy U = -15 × 10-20 J, with U(∞) = 0.
(a) What is the sign of the charge on the shell?
(b) If the electron is replaced by a proton, what would be the electric potential energy of the new system?
Answer:
A charged spherical conductor is equivalent to a point charge at its centre. For U(∞) = 0, the potential energy of two point charges q1 and q2 a distance r21 apart is
U = \(\frac{1}{4 \pi \varepsilon_{0}} \frac{q_{1} q_{2}}{r_{21}}\)
Since the FE of the charged shell and electron system is negative, the shell must be positively charged, electron being negatively charged.
If the electron is replaced by a proton, the PE of the new system would be positive equal to U’ = ±15 × 10-20 J.
Question 35.
Obtain an expression for the potential energy of a configuration of N point charges.
Answer:
Consider assembling a configuration of N point charges q1, q2, q3, …………., q at points A, B, C, D, …, respectively, in a region free of external electric field. Let \(\overrightarrow{r_{1}}, \overrightarrow{r_{2}}, \overrightarrow{r_{3}}, \ldots, \overrightarrow{r_{N}}\) be the position vectors of the points A, B, C, D, … etc., respectively, with respect to an arbitrary reference frame.
No work is done in bringing the first charge q1 from infinity to point A, so W1 = 0. Subsequently, the potential at B is
VB = \(\frac{1}{4 \pi \varepsilon_{0}} \frac{q_{1}}{r_{21}}\)
where r21 = \(\left|\vec{r}_{21}\right|, \vec{r}_{21}=\vec{r}_{2}-\vec{r}_{1}\) being the position vector of B with respect to A. Consequently, the work done by an external agent in bringing q2 from infinity, to B in the electric field of q1 is
W2 = VB . q2
= \(\frac{1}{4 \pi \varepsilon_{0}} \frac{q_{1} q_{2}}{r_{21}}\)
Subsequently, the potential at C is
VC = V1 + V2
where V1 and V2 are the potentials due to q1 and q2.
Consequently, the work done by the external agent in bringing the third charge q3 from infinity to C in the electric fields of q1 and q2 is
W3 = VC . q3
= \(\frac{1}{4 \pi \varepsilon_{0}}\left(\frac{q_{1} q_{3}}{r_{31}}+\frac{q_{2} q_{3}}{r_{32}}\right)\)
Now, the potential at D is
VD = V1 + V2 + V3
= \(\frac{1}{4 \pi \varepsilon_{0}}\left(\frac{q_{1}}{r_{41}}+\frac{q_{2}}{r_{42}}+\frac{q_{3}}{r_{43}}\right)\)
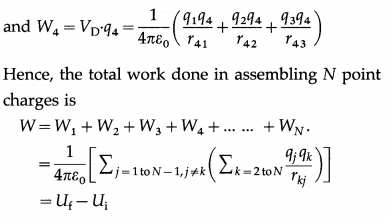
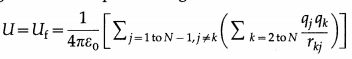
Since the charges were brought from infinity where the potential energy is assumed to be zero, Ui = 0. Therefore, the potential energy of the con figuration of N point charges is
Question 36.
What is the potential energy of a point charge in an external electric field?
Answer:
Consider a charge q placed in an external electric field at a point whose position vector with respect to an arbitrary reference frame is \(\vec{r}\). If V(\(\vec{r}\)) is the potential of the point, with respect to an arbitrary reference zero at infinity, then the potential energy of the charge q at the point is
U(\(\vec{r}\)) = qV(\(\vec{r}\))
where it is assumed that q is sufficiently small and does not significantly distort the electric field and the potential at the point.
Question 37.
Derive an expression for the potential energy of a system of two point charges in an external field.
Answer:
Consider assembling a system of two point charges q1 and q2 at points A and B, respectively, in a region of external electric field. Let \(\vec{r}_{1}\) and \(\vec{r}_{2}\) be the position vectors of A and B, respectively, with respect to an arbitrary reference frame. \(\vec{r}_{21}=\overrightarrow{r_{2}}-\overrightarrow{r_{1}}\) is the position vector of B with respect to A. Let V1 and V2 be the electric potentials of A and B due to the external field.
The work done in bringing the charge q1,from infinity to A against the electric force of the external field is
W1 = q1 V1
Subsequently, the electric potential at B is
VB = V2 + V’due t0 q1
= V2 + \(\frac{1}{4 \pi \varepsilon_{0}} \frac{q_{1}}{r_{21}}\)
Consequently, the work done in bringing the second charge q2 from infinity to B is
W2 = q2VB
= q2V2 + \(\frac{1}{4 \pi \varepsilon_{0}} \frac{q_{1} q_{2}}{r_{21}}\)
Hence, the total work done by an external agent in assembling the two point charges in a region of external electric field is
W = W1 + W2
= q1V1 + q2V2 + \(\frac{1}{4 \pi \varepsilon_{0}} \frac{q_{1} q_{2}}{r_{21}}\)
Since the charges were always kept in equilibrium, the change in the potential energy of the system Uf – Ui = W. Also, since the charges were brought from infinity where their potential energy is assumed to be zero, Ui = 0. Therefore, the potential energy of the system of two charges in an external field is
U = Uf = q1V1 + q2V2 + \(\frac{1}{4 \pi \varepsilon_{0}} \frac{q_{1} q_{2}}{r_{21}}\)
Question 38
Derive an expression for the electric potential energy of an electric dipole in a uniform electric field.
OR
Derive an expression for the total work done in rotating an electric dipole through an angle θ in a uniform electric field.
Answer:
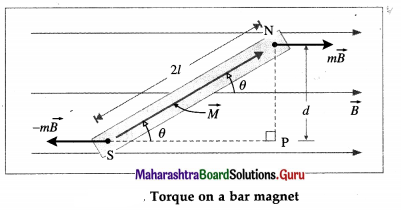
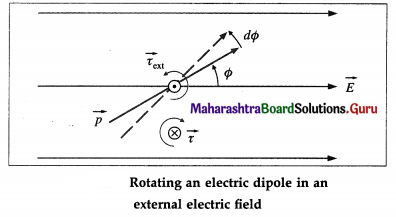
Consider an electric dipole of dipole moment \(\vec{p}\) placed in a uniform electric field \(\vec{E}\) making an
angle Φ with \(\vec{E}\). The torque \(\vec{\tau}=\vec{p} \times \vec{E}\) tends to rotate the dipole and align it with \(\vec{E}\).
Suppose an external torque \(\vec{\tau}_{\text {ext }}\), equal in magnitude and opposite in direction to \(\vec{\tau}\), is applied to rotate the dipole through an infinitesimal angular displacement dΦ, always keeping the dipole in equilibrium.
The work done by this torque is
dW = τext dΦ
= p E sin Φ dΦ
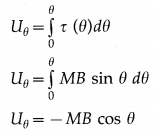
In a finite angular displacement from θ0 to θ, the total work done on the dipole by the external agent is
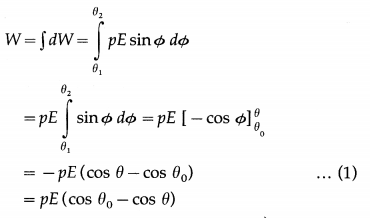
If the dipole was initially parallel to \(\vec{E}\), θ0 = 0 and cos θ0 = 1.
∴ W = pE (1 – cos θ) …………. (2)
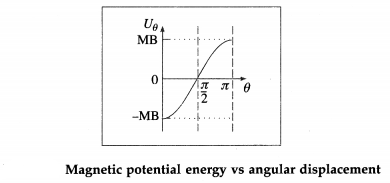
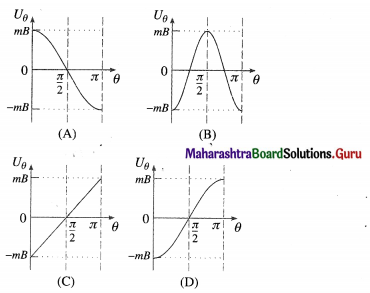
If the dipole was initially parallel to \(\vec{E}\), its potential energy U0 = – pE is minimum (more negative). If we arbitrarily assign U0 = 0 to the minimum of potential energy, the potential energy for the system for an inclination θ is
Uθ = – pEcos θ = – \(\vec{p} \cdot \vec{E}\)
This is the required expression.
39. Solve the following
Question 1.
Consider a point charge q = 1.5 × 10⁻⁸ C. What is the radius of an equipotential surface having a potential of 30V?
Solution:
Data: q = 1.5 × 10⁻⁸ C,
1/4πε0 = 9 × 10⁹ N∙m2/C2, V = 30 V
An equipotential surface surrounding an isolated point charge is a sphere centred on the charge. Let r be the radius of such an equipotential for which V = 30 V.
Question 2.
Two charged spherical conductors, of radii R1 and R2 and surface charge densities σ1 and σ2, are connected by a thin conducting wire. Except for this connecting wire, the spheres are sufficiently separated to be considered as isolated. Show that σ1R1 = σ2R2.
Solution:
The electrical potential at the surface of an isolated, charged conducting sphere of radius R is
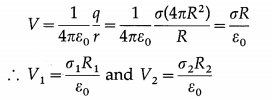
Since the spherical conductors are connected by a conducting wire, the system must be equipotential, i.e.,
V1 = V2.
∴ \(\frac{\sigma_{1} R_{1}}{\varepsilon_{0}}=\frac{\sigma_{2} R_{2}}{\varepsilon_{0}}\)
∴ σ1R1 = σ2R2 as required
[Note : Although the above connected system is different from a typical conductor with a variable radius of curvature, the above relation qualitatively indicates how charge density varies over the surface of a conductor of arbitrary shape. The equation indicates that σ and E are small where the radius of curvature is large. Conversely, σ and E are higher at locations with a small radius of curvature. A practical application of this phenomenon is the lightning rod.]
Question 3.
Two equipotential surfaces A and B in a uniform electric field, with VA = 50 V and VB = 30 V, are 10 cm apart. Two point charges, q1 = 3 nC and q2 = 5 nC, are placed on A and B, respectively.
(i) What is the magnitude of the electric field?
(ii) 1f the line joining the two charges is parallel to the field, what is the total work done in assembling the two charges?
Solution:
Data: VA = 50 V, VB = 30 V, l = 10 cm = 0.1 m,
q1 = 3 nC = 3 × 10⁻⁹ C, q2 = 5 nC = 5 × 10⁻⁹ C,
1/4πε0 = 9 × 10⁹ N∙m2/C2
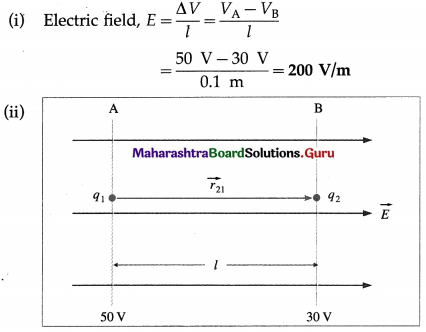
Since the line joining the two charges is parallel to the fle1d,\(\overrightarrow{r_{21}}\) = l = 0.1 m.
The work done by an external agent in assembling the two charges by bringing them from infinity is
W = q1VA + q2VB + \(\frac{1}{4 \pi \varepsilon_{0}} \frac{q_{1} q_{2}}{r_{21}}\)
=(3 × 10⁻⁹ C)(50 V) + (5 × 10⁻⁹ C)(30 V) + (9 × 10⁹ N∙m2/C2) \(\frac{\left(3 \times 10^{-9} \mathrm{C}\right)\left(5 \times 10^{-9} \mathrm{C}\right)}{0.1 \mathrm{~m}}\)
= 1.5 × 10⁻⁷ + 1.5 × 10⁻⁷ + 13.5 × 10-7
= 16.5 × 10-7 = 1.65 × 10⁻⁶ J (= 1.65 μJ)
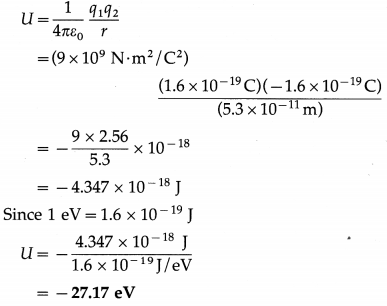
Question 4.
An electron is circulating around the nucleus of an H-atom in a circular orbit of radius 5.3 × 10⁻¹¹ m Calculate the electric potential energy of the atom in eV.
Solution:
Data: e = 1.6 × 10⁻¹⁹ C, r = 5.3 × 10⁻¹¹ m,
1/4πε0 = 9 × 10⁹ N∙m2/C2
The charge of the single proton in the nucleus of a hydrogen atom, q1 = + e = 1.6 × 10⁻¹⁹ C
The charge on the electron,
q2 = -e = -1.6 × 10⁻¹⁹ C
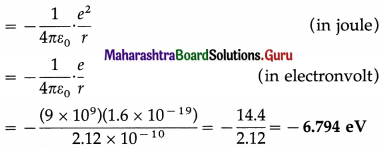
The potential energy of an H-atom,
Question 5.
A proton is to be suspended in vacuum between two parallel plates separated by 1 mm. Find (i) the electric field required (ii) the potential difference between the plates corresponding to the desired field. [mp = 1.67 × 10⁻²⁷ kg]
Solution:
The gravitational force on the proton should be balanced by the force due to the electric field. So, the electric field must be directed up; the upper plate should be at negative potential and the lower plate at positive potential, as shown in below figure.
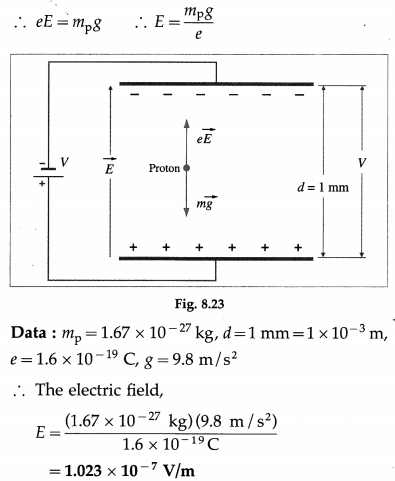
For uniform field,
E = \(\frac{V}{d}\), where V = potential difference between the plates and d = distance between the plates.
The potential difference,
V = Ed = (1.023 × 10⁻⁷ V/m)(10-3 m)
= 1.023 × 10⁻¹⁰ V
Question 6.
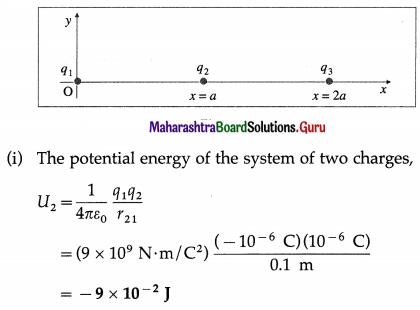
Two point charges, q1 = – 1 μC and q2 = +1 μC, are located in vacuum on the x-axis at x = 0 and x = a, respectively. (i) Find the potential energy of the system. (ii) If a third point charge q3 = + 1 μC is brought from infinity to x = 2a, find the total potential energy of the system of the three charges. (iii) What work has been done by an external agent to bring in the third charge? Take a = 10 cm.
Solution:
Data:q1 = – 1 μC = – 1 × 10⁻⁶ C, q2 = q3 = 1 μC
= 1 × 10⁻⁶ C, r21 = a = 0.1 m, r31 = 2a = 0.2 m,
r32 = a = 0.1 m, 1/4πε0 = 9 × 10⁹ N∙m2/C2
(ii) The total potential energy of the system of three charges,
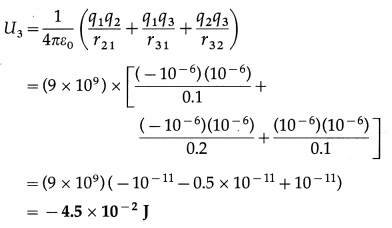
(iii) Additional work done in bringing the third charge
= U3 – U2
= (- 4.5 + 9) × 10-2 J
= 4.5 × 10⁻² J
Question 7.
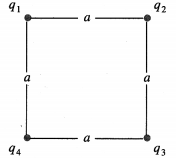
What is the electric potential energy of the following charge configuration?Take q1 = +1 × 10⁻⁸ C, q2 = – 2 × 10⁻⁸ C, q3 = +3 × 10⁻⁸ C, q4 = 2 × 10⁻⁸ C and a = 1 m. Assume the charges to be in vacuum.
Solution:
Data : q1 = +1 × 10⁻⁸ C, q2 = – 2 × 10⁻⁸ C, q3 = +3 × 10⁻⁸ C, q4 = 2 × 10⁻⁸ C
a = 1 m, 1/4πε0 = 9 × 10⁹ N∙m2/C2
r21 = r41 = r32 = r43 = 1 m, r31 = r42 = \(\sqrt {2}\) m
The electric potential energy of the given configuration of our charges is
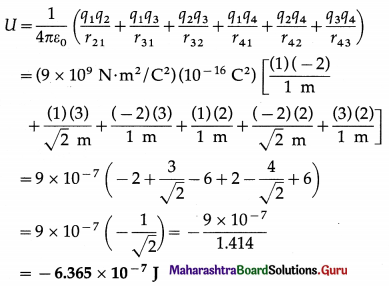
Question 8.
An electric dipole has two point charges of 1.6 × 10⁻¹⁹ C and -1.6 × 10⁻¹⁹ C separated by 2 A. ¡f the dipole is placed in a uniform electric field of 10 N/C, making an angle of 300 with the dipole moment, find (i) the magnitude of the torque acting on the dipole due to the field (ii) the potential energy of the dipole.
Solution:
Data: q = 1.6 × 10⁻¹⁹ C, 2l = 2Å = 2 × 10⁻¹⁰ m,
E = 10 N/C, θ = 30°
Electric dipole moment,
p = 2ql = q (2l) = (1.6 × 10⁻¹⁹ C)(2 × 10⁻¹⁰ m)
= 3.2 × 10⁻²⁹ A∙m2
(j) The magnitude of the torque,
τ = pE sin θ
= (3.2 × 10⁻²⁹ Am2)(10 N/C) sin 30°
= 3.2 × 10-28 × 0.5
= 1.6 × 10⁻²⁸ N∙m
(ii) The potential energy,
U = -pE cosθ
= -(3.2 × 10⁻²⁹ A∙m2)(10 N/C) cos30°
= -3.2 × 10-28 × 0.866
= -2.771 × 10⁻²⁸ J
Question 9.
A water molecule is made up of two hydrogen atoms and one oxygen atom, with a total of 10 electrons and 10 protons. The molecule is modelled as a dipole with an effective separation d = 3.9 × 10⁻¹² m between its positive and negative particles. What is the electric potential energy stored in the dipole? What does the sign of your answer mean?
Solution :
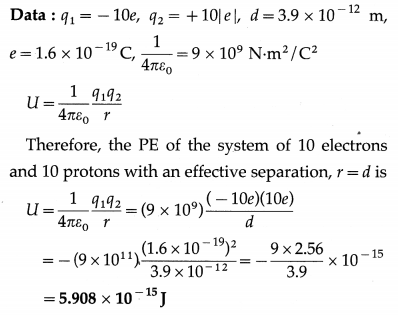
The minus sign means that in bringing the particles together horn infinity, energy is transferred from the system to the surrounding and it would take positive work by an external agent to separate the charged particles of the dipole.
Question 10.
An electric dipole consists of two unlike charges of magnitude 2 × 10⁻⁶ C separated by 4 cm. The dipole is placed in an external field of 105 N/C. Find the work done by an external agent to turn the dipole through 180°.
Solution:
Data: q = 2 × 10⁻⁶, 2l = 4cm = 4 × 10⁻² m.
E = 105 N/C, θ = 180° + θ0
Let us assume the dipole is initially aligned parallel to the field, i.e., θ0 = 0.
Then, θ = 180°.
The work done by an external agent,
W = pE(1 – cos θ)
= q (2l) E(1 – cos 180°)
= (2 × 10⁻⁶ C)(4 × 10⁻² m)(105 N/C) [1 – (-1)]
= 16 × 10-3 J
Question 11.
An electric dipole has opposite charges of magnitude 2 × 10-15 C separated by 0.2 mm. It is placed in a uniform electric field of 103 N/C. (i) Find the magnitude of the dipole moment. (ii) What is the torque on the dipole when the dipole moment is at 60° with respect to the field?
Solution:
Data : q = 2 × 10-15 C, 2l = 0.2 mm = 2 × 10⁻⁴ m,
E = 103 N/C, θ = 60°
(i) The magnitude of the dipole moment is
V = q (2l)
= (2 × 10-15 C) (2 × 10⁻⁴ m)
= 4 × 10-19 C∙m
(ii) The torque on the dipole is
τ = pE sin θ
= (4 × 10-19 C∙m) (103 N/C) sin 60°
= 4 × 10-16 × 0.866 = 3.46 × 10⁻¹⁶ N∙m
Question 40.
What constitutes an electric shock?
Answer:
Living organisms are electrical conductors. Electric shock is the result of the passage of electric current through our body. During electric shock we experience an extreme stimulation of nerves and muscles. It needs a minimum of 1 mA of electric current to pass through our body for us to experience a shock.
Question 41.
Birds perched on electrical transmission wires do not suffer electric shock, but if a person touches both the wires at once receives a tremendous shock. Why?
Answer:
The danger of electric shock arises not from mere contact with a live wire but rather from simultaneous contact with a live wire and another body or wire at a different potential so that our body provides a conducting path between the two and a current passes through our body.
Touching a single wire by the birds does not result in a current through their bodies because then the electric circuit is not complete. But if a person touches two wires at different potentials at once, or if a bare-footed person touches the live wire only, the electric circuit is complete and the person receives an electric shock. In the latter case, the current from the wire passes to the Earth through the body.
[Notes : (1) We must not touch any electric appliance. when bare-footed or with wet hands. When a bare-footed person touches a short-circuited electric appliance, the current from such an appliance goes to the Earth through his body, thus completing the circuit. When our skin is dry, the electrical resistance of our body is about 50 kΩ, a wet skin lowers the resistance to 10 kΩ. It needs a minimum of 1 mA of electric current to pass through our body for us to experience a shock. Thus, when dry, it needs at least 50 V potential difference to get a shock, but only 10 V is enough when wet. (2) The Earth often serves as a charge reservoir known as a ground. A ground can accept or provide electrons freely, and it is so large that the addition or subtraction of electrons has a negligible effect on it. So, the ground remains essentially neutral at all times. When something is connected to the ground by a conductor, we say that it is earthed or grounded.]
Question 42.
State the properties of conductors in electrostatic conditions.
Answer:
Properties of a charged conductor in electrostatic conditions :
- Net electric field inside the conductor is zero.
- Net electric field just outside the conductor is normal to its surface at every point.
- Electric potential inside the conductor is constant and equal to that on its surface.
- Excess charges reside only on the surface of the conductor but, for a conductor of arbitrary shape, the surface charge density at a point is inversely proportional to the local curvature of the surface.
Question 43.
Explain electrostatic shielding. What is a Faraday cage ?
Answer:
When an isolated conductor, uncharged or charged, is placed in an external electric field, as in figure, all points of the conductor come to the same potential. The free conduction electrons in the conductor distribute themselves on the surface, leaving a net positive charge on some regions of the surface and a net negative charge on other regions.
This charge distribution causes an additional electric field at interior points such that the total field at every point inside is zero.
The charge distribution on the conductor is such that the net electric field at all points on the surface to be perpendicular to the surface, thereby altering the shapes of the field lines near the conductor.
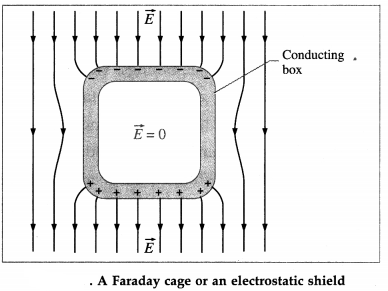
The use of a conducting box to protect sensitive instruments from stray electric fields, or the use of a conducting wire cage to protect a person near a high-voltage installation or from lightning strike, is called electrostatic shielding. The hollow conductor or the conducting wire cage that shields its interior from external electric fields is called a Faraday cage or Faraday shield. A Faraday cage, made from a contiguous metal sheet or from a fine metal mesh, is used to shield its content or occupant from static and nonstatic electric fields.
Question 44.
Aran and Careena were driving in the countryside in a car when they get caught in a thunderstorm. Arun is worried that if lightning hits the car, the petrol tank may explode. Careena thinks they should wait out the storm in the car. Is Careena right ?
Answer:
In circumstances where there is danger of lightning strikes, it is wise to enclose oneself in a cavity inside a conducting shell, where the electric field is guaranteed to be zero. A car with a metal body is an almost ideal Faraday cage. When a car is struck by lightning, the charge flows on the outside surface of the car to the ground but the electric field inside remains zero. This leaves the passengers inside unharmed. Also, the petrol is in a metal tank which also acts like a Faraday cage. So, Careena is right.
Question 45.
Explain the electrical behaviour of conductors and insulators on the basis of free and bound charges inside the materials.
Answer:
In a material, the inner shell electrons are tightly bound to their respective nuclei and together they have fixed lattice positions. They are called bound charges.
In metals, the outermost valence electrons are loosely bound to their respective nucleus and, due to the regular atomic arrangement in a lattice, are set free to move inside the metal. They are called free charges or free electrons. Under an applied electric field, the free electrons drift in a direction opposite to the electric field and constitute an electric current in the metal. In electrolytes, electrical dissociation of ionic molecules results in both positive and negative free charges, and electric conduction is due to both types of free charges. Under electrostatic conditions, excess charges reside only on the surface of a conductor.
In insulators, all inner shell and outer shell electrons are tightly bound to their respective nuclei so that even at room temperature the number of free charges is several orders lower than that in a metallic conductor. Hence, they are poor conductors of electricity and heat. In the absence of free conduction electrons, excess charges transferred to an insulator remain localized. An insulator can have non-zero surface charge density as well as volume charge density.
Question 46.
You can charge a glass or rubber rod by holding one end of the rod and rubbing the other end with a silk cloth. But you cannot charge a copper rod in the same way. Explain.
Answer:
Glass and rubber are insulators. An excess charge (positive or negative) building up on some part of an insulator remains localized. So, a glass or rubber rod can be held at one end while the far end is being rubbed with silk. The far end of the rod acquires a surplus of electrons but those electrons never flow into the ground through the hand.
A copper rod is an example of a conductor which has free conduction electrons. On holding one end of the copper rod and rubbing the other end with silk, electrons are transferred from the silk to the copper rod, and those excess electrons are free to flow. Because like charges repel, the electrons move away from one another, travel through the rod to the ground through the hand. As a result, the copper rod remains neutral despite the rod being rubbed with silk.
Question 47.
What do you mean by a polar molecule and a nonpolar molecule ? Give two examples of each.
Answer:
A polar molecule is an asymmetric molecule with a permanent electric dipole moment that arises from the finite separation of the centres of the net positive charge and the net negative charge in the molecule, even in the absence of an external electric field.
Dipole moments of polar molecules are of the order of 10-30 C∙m.
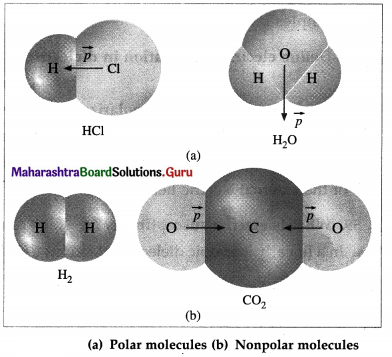
Examples : Gaseous hydrogen halides (HF, HCl, etc.); NH3, NO2, N2O, water molecules; all hetero- nuclear diatomic molecules (with any covalent bond between two different atoms).
A nonpolar molecule is one which does not have a permanent electric dipole moment because in the absence of an external electric field, the centres of the net positive charge and the net negative charge in the molecule coincide. Thus, it is a symmetric molecule.
Examples : H2, CO2, N2, O2, methane, polyethylene, polystyrene.
[Note : The asymmetric charge distribution in a polar molecule arises from differences in electronegativity and other features of bonding. A heteronuclear polyatomic molecule may be nonpolar if the vector sum of the bond dipole moments is zero, as in CO2, CH4, CCl4, etc. The absence or presence of a dipole moment in a polyatomic molecule can be a revealing clue to the structure of the molecule. For example, BF3 with a planar trigonal sym-metric structure is nonpolar, while PF3 with a trigonal pyramidal structure is polar. Of the two isomers of dichloroethylene, cis is polar while trans is nonpolar.]
Question 48.
What is the bond angle and bond dipole moment of a water molecule?
Answer:
In a water molecule, the bond angle between the two O-H bonds is 104.5° and the dipole moment (known as the bond dipole moment) is about 6.17 × 10⁻³⁰ C∙m
[Note: The SI unit of dipole moment, the coulomb-metre is too large at molecular level. Hence, bond dipole moments are commonly expressed in the CGS unit, the debye (D); 1 D = 3.335 × 10⁻³⁰ C m. So, the bond dipole moment of a water molecule is 1.85 D while that of HF, NH3 and HCl are 1.82 D, 1.47 D and 1.08 D, respectively.]
Question 49.
What is a dielectric? State its two types. Give two examples in each case.
Answer:
A dielectric is an electrical insulator i.e., a nonconducting material, that can be polarised by an applied electric field which slightly displaces the positive and negative charges of each molecule. A dielectric can sustain a high electric field up to a certain limit. An ideal dielectric has no free charges.
Important commercial dielectrics are of two types, polar and nonpolar.
Examples :
Polar dielectrics : Silicones, halogenated hydrocarbons.
Nonpolar dielectrics : (1) Solid : Ceramics, glasses, plastics (polyethylene, polystyrene, etc.) mica, paper. (2) Liquid : Mineral oils.
Question 50.
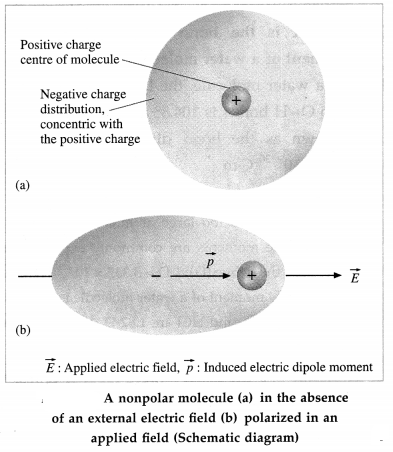
With the help of neat diagrams, explain how a nonpolar dielectric material is polarised in an external electric field.
OR
Explain the behaviour of nonpolar dielectric material in an external electric field.
Answer:
In the absence of an external electric field, the molecules of a nonpolar dielectric have no inherent electric dipole moments. An applied electric field slightly separates the centres of negative and positive charges. Then, a nonpolar molecule acquires an induced dipole moment in the direction of the applied field, as shown in figure. The induced dipole moments of all the molecules add up giving the dielectric a net induced electric dipole moment • in the presence of the applied field.
Question 51.
With the help of neat diagrams, explain how a polar dielectric material acquires a dipole moment in an external electric field.
OR
Explain the behaviour of polar dielectric material in an external electric field.
Answer:
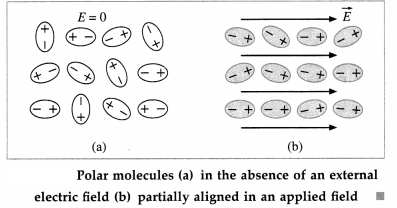
In the absence of an external electric field, the permanent electric dipole moments of the molecules of a polar dielectric orient in random directions due to thermal agitation such that their vector sum is zero, from figure (a).
An applied electric field does slightly increase the separation between the centres of negative and positive charges. But, a much larger effect is the tendency of the dipole moments to align with the field, although thermal agitation prevents complete alignment, as shown in from figure (b). Due to the partial alignment of the dipole moments, a polar dielectric also acquires a net induced electric dipole moment in the direction of the applied field. The extent of polarisation depends on the relative values of the two opposing tendencies : (1) the tendency of the applied field to align the dipoles
(2) thermal agitation that tends to randomize.
Question 52.
What is a linear isotropic dielectric? Give one example.
Answer:
A linear isotropic dielectric is one which when placed in a uniform electric field acquires an induced electric dipole moment in the direction of the field and proportional to the applied electric field intensity.
Examples : Mica, glass.
Question 53.
Define electric polarization in dielectrics.
Answer:
Definition The electric polarization at every point within a dielectric is defined as the electric dipole moment per unit volume. It has the direction of the external electric field.
Question 54.
What is electric susceptibility ?
Ans. In a linearly isotropic dielectric placed in a uniform electric field, the electric polarization \(\vec{P}\) is directly proportional to the electric field intensity \(\vec{E}\) inside the dielectric.
∴ \(\vec{P}\) = χeε0\(\vec{E}\)
where the proportionality constant χe, a positive quantity, is called the electric susceptibility of the dielectric.
[Note : χe is dimensionless. SI units of P and E are C/m2 and N/C.]
Question 55.
Explain the reduction of electric field inside a polarized dielectric.
OR
Explain the behaviour of a dielectric slab which is subjected to an external electric field.
Answer:
Consider a rectangular slab of a linear isotropic dielectric placed in a uniform external electric field.
In case of a nonpolar dielectric, the applied field slightly separates the centres of negative and positive charge in a molecule inducing an electric dipole moment in the direction of the field. In most cases, this separation is a very small fraction of a molecular diameter. In case of a polar dielectric, the permanent dipole moments of its molecules are partially aligned with the field. In either case, the dielectric is said to become polarized.
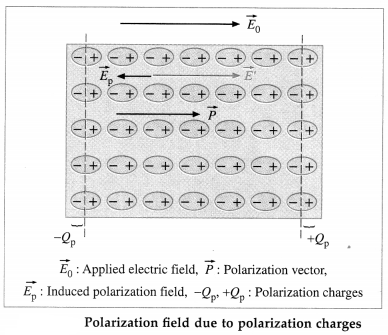
In a uniformly polarized dielectric, the charges of adjacent interior dipoles add to zero. But due to the unbalanced positive ends of dipoles at one face of the slab, bound positive charge appears on that exterior surface. Similarly, bound negative charge appears on the opposite exterior surface of the slab. These bound surface charges are called polarization charges. There is, however, no excess charge in any volume element within the slab and the slab as a whole remains electrically neutral.
The external electric field \(\overrightarrow{E_{0}}\) polarizes the dielectric, with a net polarization \(\vec{P}\) parallel to \(\overrightarrow{E_{0}}\). Within the dielectric, the induced field \(\vec{E}_{\mathrm{p}}=-\vec{P} / \varepsilon_{0}\) due to the polarization charges is opposite to the applied field, from figure.
\(\vec{E}=\vec{E}_{0}+\vec{E}_{\mathrm{p}}=\vec{E}_{0}-\vec{P} / \varepsilon_{0}\)
i.e., E = E0 – Ep in magnitude.
Assuming the dielectric to be isotropic and linear,
\(\vec{P}\) = χeε0 \(\vec{E}\)
where χe is the electric susceptibility of the dielectric.
∴ \(\overrightarrow{E_{0}}\) = (1 + χe)\(\vec{E}\) = k\(\vec{E}\)
where k = 1 + χe is the dielectric constant. This implies E = E0/k, thus less than E0. Thus, the effect of a dielectric material is always to decrease the electric field below the applied electric field.
[Note : The charges + Q and – Q on the plates of a capacitor are said to be free charges because they can move when the potential difference between the plates is changed.]
Question 56.
How does the electric field inside a dielectric decrease when it is placed in an external electric field?
Answer:
Suppose a rectangular slab of dielectric is placed in an electric field \(\overrightarrow{E_{0}}\), with two of its parallel sides perpendicular to the field. The dielectric becomes polarized. Polarization charges appear on the external surfaces of these two parallel sides such that within the dielectric the field due to the polarization charges is opposite to \(\overrightarrow{E_{0}}\). Thus, the magnitude of the net electric field \(\vec{E}\) within the dielectric is less than \(\left|\overrightarrow{E_{0}}\right| \cdot E=\frac{E_{0}}{k}\), where k is the relative permittivity (dielectric constant) of the dielectric.
Question 57.
Is vacuum the best dielectric, meaning is its dielectric strength infinite ?
Answer:
In principle, an absence of particles mean no breakdown. However, practical vacuum still has large number of particles of residual gases. In practice, only pressures lower than 10-2 mbar can be considered to provide a real dielectric insulation. In such vacuum, free electrical charges under a sufficiently high force can produce ionization and breakdown of its insulation properties. Thus, the dielectric strength of vacuum is only about 20 kV/mm, better than air but lower than most solid dielectrics.
Question 58.
What is a capacitor ?
Explain capacitance of a capacitor.
Answer:
A capacitor is a device used to store electrical charge and electrical energy. It consists of at least two electrical conductors, called as capacitor plates, separated by a distance. The space between the plates may simply be air or, usually, filled with a dielectric.
Consider a capacitor having two conducting plates close to, but not touching, one another shown in figure. Imagine that each plate is neutral, so the potential difference between the plates is zero. If a small positive charge q is transferred from one plate
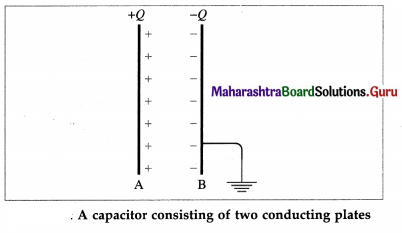
to the other, the second plate acquires a charge + q while that on the first plate is — q and a small potential difference appears between the plates. As the amount of charge on each plate increases, so does the potential difference between the plates. The potential difference AV between the plates is directly proportional to the magnitude of charge Q on each plate : Q ∝ ∆V.
∴ Q = C∆V
The constant of proportionality C is called the capacitance. The capacitance depends only on the geometry of the plates and the type of dielectric between the plates.
When the terminals of a battery are connected to the plates of an initially uncharged capacitor, the battery potential V moves a small amount of charge of magnitude Q from the plate at the higher potential to the other plate. The capacitor remains neutral overall, but with charges + Q and – Q on opposite plates. The capacitance C is then the ratio of the maximum charge Q that can be stored in the capacitor to the applied voltage V across its plates or, in other words, capacitance is the largest amount of charge per unit potential difference that can be stored on the device.
[Note : A capacitor is represented in circuit diagrams by the symbol,  ]
]
Question 59.
The graph shows the potential difference ∆V between the plates of a capacitor versus the charge Q on its plates. Use the graph to find (1) the capacitance of the capacitor (2) the magnitude of the excess charge on its plates.
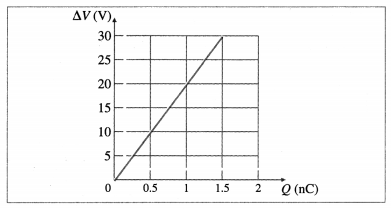
Solution:
C = \(\frac{Q}{\Delta V}=\frac{1}{\text { slope }}=\frac{1.5 \mathrm{nC}}{30 \mathrm{~V}}\) = 0.05 nF = 50 pF
From the graph, for Q = 0.5 nC, ∆V = 10 V.
Question 60.
Define the capacitance of a capacitor. State and define the SI unit of capacitance.
Answer:
(1) Definition : The capacitance (capacity) of a capacitor is defined as the ratio of the charge on either conductor to the potential difference between the two conductors forming the capacitor.
(2) The SI unit of capacitance is the farad.
Definition : The capacitance of a capacitor is said to be one farad if a charge of one coulomb is required to increase the potential difference between the two conductors forming the capacitor by one volt.
1 farad = 1 coulomb/volt; 1 F = 1 C/V
[Note : Capacitors in common electronic circuits are in microfarad (10-6 F), nanofarad (10-9 F) or picofarad (10-12 F).]
Question 61.
State and explain the principle of a capacitor.
Answer:
Principle of a capacitor : Any conductor can be used to store charges, however, its capacity can be increased by keeping a grounded conductor near it.
Consider a metal plate A whose potential is raised to V by depositing a charge + Q on it, so that its capacity is C = Q/V. Now, if an uncharged metal plate B is brought close to plate A, then negative bound charge – Q will be induced on the surface of B near A and positive free charge + Q on the other side of B, from figure (a).
If plate B is grounded, i.e., connected to the Earth, the free charge on it will escape to the Earth, from figure (b). The bound charge (- Q) thus remaining on B will lower the potential of A, as if superimposing a potential – V1 on the potential V of plate A. The resultant potential of A will become V – V1 and its capacity will be Q/(V – V1).
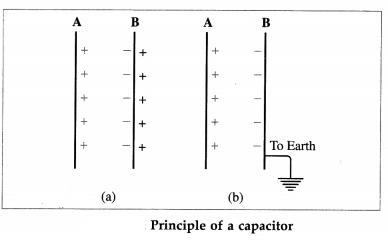
C’ = \(\frac{Q}{V-V_{1}}\)
Keeping plate B very close to A, V – V1 can be made very small, so that the capacity of the combination can become very much greater than the capacity of conductor A alone. C’ >> C
Question 62.
What are the different types of capacitors? Describe in brief.
Answer:
The three main types of capacitors depending on their shape are (1) parallel-plate capacitor (2) spherical capacitor (3) cylindrical capacitor.
(1) Parallel-plate capacitor: It consists of two parallel metal plates, separated by a small gap [from figure (a)] of air or filled with a dielectric. The charge to be stored is given to one plate (A) while the other plate (B) is earthed.
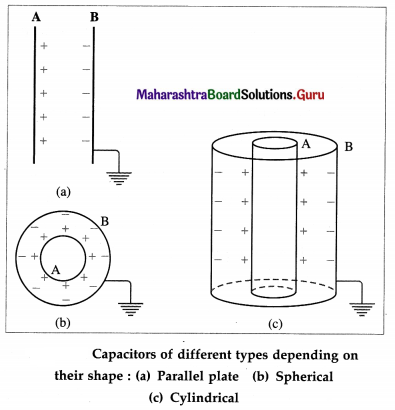
(2) Spherical capacitor: It consists of two concentric spherical conductors, separated by a small gap of air or filled with a dielectric [from figure (b)]. The charge to be stored is given to the inner sphere (A), while the outer sphere (B) is earthed.
(3) Cylindrical capacitor : It consists of two coaxial, cylindrical conductors separated by a small gap of air or filled with a dielectric [from figure (c)]. The charge to be stored is given to the inner cylinder (A), while the outer cylinder (B) is earthed.
Depending on the dielectric used, the capacitors of different types are (1) mica capacitor (2) air capacitor (3) paper capacitor (4) electrolytic capacitor, etc.
Question 63.
Derive an expression for the effective or equivalent capacitance (capacity) of a combination of a number of capacitors connected in series.
OR
Derive an expression for the effective capacitance of three capacitors connected in series.
Answer:
In the series arrangement of capacitors, the capacitors are connected end to end and a cell is connected across the combination of the capacitors as shown in figure.
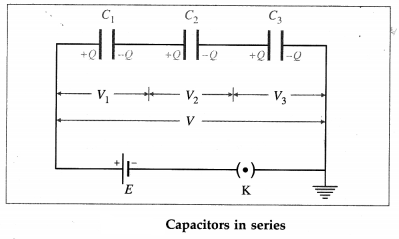
Let C1, C2, C3 be the capacitances of the three capacitors connected in series and Q, the charge on each capacitor. Let V1, V2, V3 be the potential differences across the capacitors.
Now, charge = capacitance x potential difference
∴ Q = C1V1 = C2V2 = C3V3
∴ V1 = \(\frac{Q}{C_{1}}\), V2 = \(\frac{Q}{C_{2}}\) and V3 = \(\frac{Q}{C_{3}}\)
If Vis the potential difference across the combination and C is the equivalent or effective capacitance of the combination, we have,
C = \(\frac{Q}{V}\) ∴ V = \(\frac{Q}{V}\)
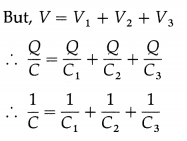
In general, if n capacitors of capacitances C1, C2, C3, …, C, are connected in series, the equivalent capacitance (C) of the combination is given by
\(\frac{1}{C}=\frac{1}{C_{1}}+\frac{1}{C_{2}}+\frac{1}{C_{3}}+\ldots+\frac{1}{C_{n}}\)
Question 64.
Derive an expression for the effective or equivalent capacitance (capacity) of a combination of a
number of capacitors connected in parallel.
OR
Derive an expression for the effective or equivalent capacitance of three capacitors connected in parallel.
Answer:
In the parallel arrangement of capacitors, the capacitors are connected between two common points and a cell is connected across the combination of the capacitors as shown in below figure. Thus, the potential difference (V ) across each capacitor is the same, Let C1, C2, C3 be the capacitances of the three capacitors connected in parallel and C, the equivalent or effective capacitance of the combination. The charge Q supplied by the cell is distributed as Q1, Q2 and Q3 on the capacitors.
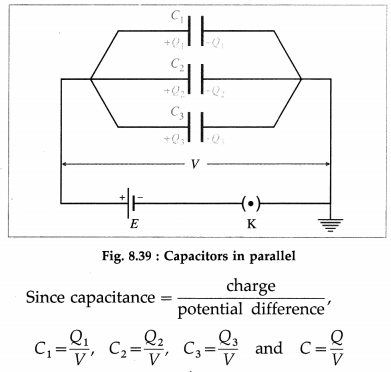
∴ Q1 = C1V, Q2 = C2V, Q3 = C3V and Q = CV
Since, Q = Q1 + Q2 + Q3
CV = C1V + C2V + C3V
∴ C = C1 + C2 + C3
In general, if n capacitors are connected in parallel,
C = C1 + C2 + ……. + Cn .
65. Solve the following
Question 1.
Three capacitors have capacities 2 µF, 4 µF and 8 µF. Find the equivalent capacity when they are connected in (a) series (b) parallel.
Solution:
Data : C1 = 2 µF, C2 = 4 µF, C3 = 8 µF
(a) Series arrangement:
\(\frac{1}{C_{s}}=\frac{1}{C_{1}}+\frac{1}{C_{2}}+\frac{1}{C_{3}}=\frac{1}{2}+\frac{1}{4}+\frac{1}{8}=\frac{7}{8}\)
The equivalent capacity,
∴ Cs = \(\frac{8}{7}\) = 1.143 µF
(b) Parallel arrangement:
The equivalent capacity is
Cp = C1 + C2 + C3 = 2 + 4 + 8 = 14 µF
Question 2.
The equivalent capacitance of two capacitors is 6 µF when they are connected in series and 25 µF when they are connected in parallel. Find the capacitance of each capacitor.
Solution:
Data : Cs = 6 µF, Cp = 25 µF
Let C1 and C2 be the capacitances of the two capacitors respectively.
In parallel combination,
Cp = C1 + C2 = 25
In series combination,
\(\frac{1}{C_{s}}=\frac{1}{C_{1}}+\frac{1}{C_{2}}=\frac{C_{1}+C_{2}}{C_{1} C_{2}}\)
∴ Cs = \(\frac{C_{1} C_{2}}{C_{1}+C_{2}}\)
∴ 6 = \(\frac{C_{1} C_{2}}{25}\)
∴ C1C2 = 150
∴ C1(25 – C1) = 150
∴ 25C1 – C12 = 150
∴ C12 – 25C1 + 150 = 0
∴ (C1 – 15) (C1 – 10) = 0
∴ C1 = 15 µF or 10 µF
∴ C2 = 25 – C1 = 10 µF or 15 µF
∴ The capacitances of the capacitors are 15 µF and 10 µF.
Question 3.
With four capacitors of the same capacity, when three of them are connected in parallel and the remaining one in connected in series with this combination, the resultant capacity is 3.75 µF. Find the capacity of each capacitor.
Solution:
Data : Ceff = 3.75 µF
Let the capacity of each of the four capacitors be C. The equivalent capacity of three of them in parallel is
Cp = C + C + C = 3C
The equivalent capacity of the series combination of Cp and the fourth capacitor is
Ceff = \(\frac{C_{\mathrm{p}} C}{C_{\mathrm{P}}+C}=\frac{(3 C) C}{3 C+C}=\frac{3}{4} C\)
∴ By the data, \(\frac{3}{4}\) C = 3.75 µF
∴ C = \(\frac{4}{3}\) × 3.75 = 5 µF
∴ The capacity of each capacitor = 5 µF.
Question 4.
Two capacitors of capacities C1 and C2 are joined in series and this combination is joined in parallel with a capacitor of capacity C3. Show that the capacity of the system is C = \(\frac{C_{1}\left(C_{2}+C_{3}\right)+C_{2}
Solution:
The equivalent capacitance of the series combination of C1 and C2 is
Cs = [latex]\frac{C_{1} C_{2}}{C_{1}+C_{2}}\)
The equivalent capacitance of the parallel combination of Cs and C3 is
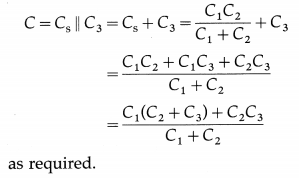
Question 5.
Capacitors of capacities 5 µF and 10 µF are connected in parallel in a circuit with a cell of emf 2 V. What should be the capacity of the capacitor to be connected in series with the parallel combination of the capacitors to get 1 µC charge on the combination?
Solution:
Data : C1 = 5 µF, C2 = 10 µF, V = 2 V, Q = 1 µC
The effective capacity of the parallel combination of C1 and C2 is
Cp = C1 + C2 = 5 + 10 = 15 µF
Let C be the capacity of the capacitor to be connected in series with Cp to get the charge of 1 coulomb on the combination. The equivalent capacity (Cs) of the series combination is given by
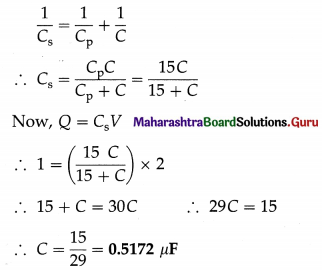
Question 6.
Three capacitors of capacities 8 µF, 8 µF and 4 µF are connected in series and a potential difference of 120 V is maintained across the combination. Calculate the charge on the capacitor of capacity 4 µF. Also calculate the potential difference across it.
Solution:
Data : C1 = 8 µF, C2 = 8 µF, C3 = 4 µF, V = 120 V
Let Cs = equivalent capacity of the series combination of the capacitors
∴ \(\frac{1}{C_{s}}=\frac{1}{C_{1}}+\frac{1}{C_{2}}+\frac{1}{C_{3}}=\frac{1}{8}+\frac{1}{8}+\frac{1}{4}\)
= \(\frac{1+1+2}{8}=\frac{4}{8}=\frac{1}{2}\)
∴ Cs = 2 µF = 2 × 10⁻⁶ F
In series combination, the charge on each capacitor is the same. It is given by Q = CsV
∴ Q = 2 × 10-6 × 120
= 2.4 × 10⁻⁴ coulomb
V3 = \(\frac{Q}{C_{3}}=\frac{2.4 \times 10^{-4}}{4 \times 10^{-6}}=\frac{240}{4}\) = 60 V (∵ C3 = 4 µF = 4 × 10⁻⁶ F)
The charge on the 4 µF capacitor is 2.4 × 10⁻⁴ C and the potential difference across it is 60 V.
Question 7.
A 100 V battery is connected across the combination of capacitors of capacities 4 µF and 8 µF in parallel and then in series. Calculate the charge on each capacitor in parallel and in series combination.
Solution:
Data : V = 100 V, C1 = 4 × 10⁻⁶ F, C2 = 8 × 10⁻⁶ F
(i) Parallel combination :
Q1 = C1V = (4 × 10⁻⁶)(100) = 4 × 10⁻⁴ C
Q2 = C2V = (8 × 10⁻⁶)(100) = 8 × 10⁻⁴ C
(ii) Series combination :
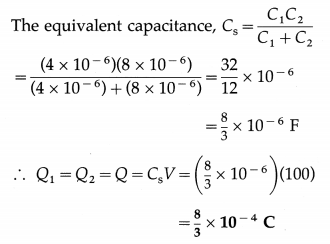
Question 8.
Three capacitors are connected as shown in the figure below.
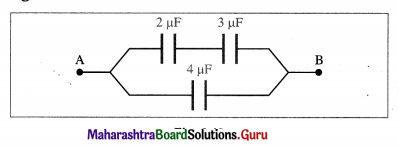
Calculate the effective capacitance between A and B.
Solution:
Data : C1 = 2 µF, C2 = 3 µF, C3 = 4 µF
The resultant capacitance Cs of C1 and C2 in series is given by
\(\frac{1}{C_{s}}=\frac{1}{C_{1}}+\frac{1}{C_{2}}=\frac{1}{2}+\frac{1}{3}=\frac{5}{6}\)
∴ Cs = \(\frac{6}{5}\) = 1.2 µF
The effective capacitance between A and B is due to the parallel combination of Cs and C3.
Cp = Cs + C3 = 1.2 + 4 = 5.2 µF
Question 9.
Four capacitors are of the same capacitance.
(a) If three of them are connected in parallel and the remaining one is connected in series with this combination, the resultant capacitance is 3.75 µF. Find the capacitance of each capacitor.
(b) When three of them are connected in series and the remaining one is connected in parallel with this combination, find the resultant capacitance of the combination.
Solution:
(a) Let C be the capacitance of each capacitor.
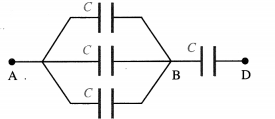
Between points A and B, three capacitors, each of capacitance C, are connected in parallel from figure. Their effective capacitance (Cp) is given by
Cp = C + C + C = 3C
When a capacitor of capacitance C is connected in series with Cp, their resultant capacitance (Cs) is given by
\(\frac{1}{C_{s}}=\frac{1}{C_{p}}+\frac{1}{C}=\frac{1}{3 C}+\frac{1}{C}=\frac{4}{3 C}\)
∴ Cs = \(\frac{3 C}{4}\)
Given : Cs = 3.75 µF
∴ \(\frac{3 C}{4}\) = 3.75
∴ C = \(\frac{4 \times 3.75}{3}=\frac{15}{3}\) = 5 µF
(b) The arrangement is shown in below figure.
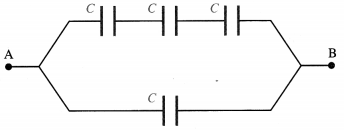
The effective capacitance (Cs) of the series combination of three capacitors, each of capacitance C, is given by
\(\frac{1}{C_{s}}=\frac{1}{C}+\frac{1}{C}+\frac{1}{C}=\frac{3}{C}\)
∴ Cs = \(\frac{C}{3}\)
When another capacitor of capacitance C is connected in parallel with the combination, the result ant capacitance is
Cp = Cs + C = \(\frac{C}{3}\) + c
= \(\frac{4 C}{3}=\frac{4 \times 5}{3}=\frac{20}{3}\)
= 6.667 µF
Question 10.
In below figure, C1 = 10 µF, C2 = 30 µF, C3 = 20 µF, C4 = 40 µF. Find the capacitance between the points A and B when (i) the key K is closed (ii) the key K is open.
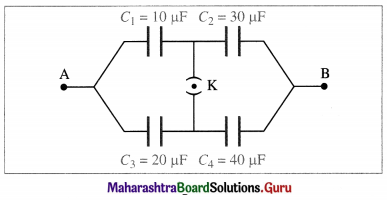
Solution:
(i) Key K closed :
The parallel combination of C1, and C3 is in series with the parallel combination of C2 and C4. Let
C5 = C1 || C3 and C6 = C2 || C4.
∴ C5 = C1 + C3 = 10 + 20 = 30 µF
and C6 = C2 + C4 = 30 + 40 = 70 µF
The capacitance between A and B is the equivalent capacitance of C5 and C6 in series, i.e.,
CAB = \(\frac{C_{5} C_{6}}{C_{5}+C_{6}}=\frac{30 \times 70}{30+70}=\frac{2100}{100}\) = 21 µF
(ii) Key K open :
The series combination of C1 and C2 is in parallel with the series combination of C3 and C4. Let C7 and C8 be the equivalent capacitances of the respective series combinations.
The capacitance between A and B is the equivalent capacitance of C7 and C8 in parallel, i.e.,
CAB = C7 + C8 = \(\frac{15}{2}+\frac{40}{3}=\frac{45+80}{6}\)
= \(\frac{125}{6}\) = 20.83 µF
Question 11.
A network of four capacitors, 5 µF each, are connected to a 240 V supply. Determine the equivalent capacitance of the network and the charge on each capacitor.
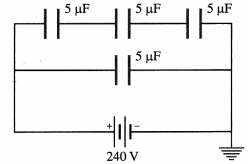
Solution:
Data : C1 = C2 = C3 = C4 = 5 µF, V = 240 V
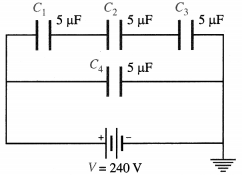
The equivalent capacitance C5 of the series combination is given by
\(\frac{1}{\mathrm{C}_{5}}=\frac{1}{\mathrm{C}_{1}}+\frac{1}{\mathrm{C}_{2}}+\frac{1}{\mathrm{C}_{3}}=\frac{1}{5}+\frac{1}{5}+\frac{1}{5}=\frac{3}{5}\)
∴ C5 = \(\frac{5}{3}\) µF
The equivalent capacitance of the parallel combination of C5 with C4 is
C = C5 + C4 = \(\frac{5}{3}\) + 5 = \(\frac{20}{3}\) µF = 6.667 µF
The potential difference across each of the three capacitors in series = \(\frac{V}{3}=\frac{240}{3}\) = 80 V
and the charge on each of them is the same.
∴ Q1 = Q2 = Q3 = C1 × \(\frac{V}{3}\) = (5 × 10⁻⁶)(80)
= 4 × 10⁻⁴ C
The charge on the capacitor C4 is
Q4 = C4V = (5 × 10⁻⁶)(240) = 1.2 × 10⁻³ C
Question 12.
Six capacitors of capacities 5 µF, 5 µF, 5 µF, 5 µF, 10 µF, and X µF are connected as shown in the network given below :
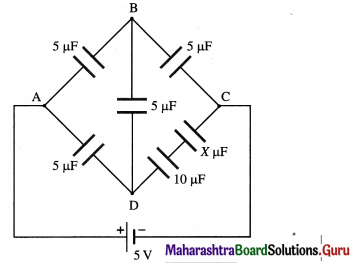
Find (a) the value of X if the network is balanced (b) the resultant capacitance between A and C.
Solution:
(a) The effective capacitance of the series combination in the arm DC is \(\frac{10 X}{10+X}\) µF
Using the balancing condition for the network,
(b) As the network is balanced, no charge flows through the arm BD.
Effective capacitance 5×5 25
CABC = \(\frac{5 \times 5}{5+5}=\frac{25}{10}\)= 2.5 µF (series combination)
Similarly,
CADC =\(\frac{5 \times 5}{5+5}=\frac{25}{10}\) = 2.5 µF (series combination)
Effective (resultant) capacitance between A and C .
= CABC + CADC (parallel combination)
= 2.5 + 2.5 = 5 µF
Question 66.
Derive an expression for the capacitance of a parallel-plate air/vacuum capacitor.
Answer:
Consider a parallel-plate capacitor, consisting of two parallel plates A and B separated by a distance d as shown in below figure. Let A be the area of each plate. Plate B is connected to the Earth. Suppose that the capacitor is connected to the terminals of a battery of potential difference V. The battery transfers a charge + Q to the insulated plate A. A charge – Q is induced on the near surface of the grounded plate B while the + Q charge on the far side of B flows to the ground.
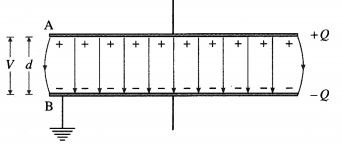
1f the area A is very large and the distance between the plates is very small, the electric field in the region between the plates is almost uniform, except near the edges. The magnitude of the electric field E at a point between the plates and the potential difference V between the plates are related by E = V/d. Outside the capacitors, the electric fields due to the two charged plates cancel out:
\(\frac{\sigma}{2 \varepsilon_{0}}-\frac{\sigma}{2 \varepsilon_{0}}\) = 0.
But, E = \(\frac{\sigma}{\varepsilon_{0}}\), where σ is the surface charge density on the plates.
∴ \(\frac{\sigma}{\varepsilon_{0}}=\frac{V}{d}\) …………. (1)
Now, = \(\frac{Q}{A}\) ∴ E = \(\frac{Q}{\varepsilon_{0} A}=\frac{V}{d}\) …………… (2)
The capacity (capacitance) of a capacitor is, by definition, C = \(\frac{Q}{V}\)
∴ C = \(\frac{\varepsilon_{0} A}{d}\) …………… (3)
This gives the capacitance of a parallel-plate capacitor without a dielectric, i.e., an air or vacuum capacitor.
Question 67.
What is the electric field intensity in the region between the plates of a parallel-plate capacitor if the separation between the plates is 1 mm and the potential difference across the plates is 2V?
Answer:
E = \(\frac{V}{d}=\frac{2}{1 \times 10^{-3}}\) = 2000 N/C is the required electric field intensity.
Question 68.
The capacitance of a parallel-plate air capacitor is 12 µF. If the separation between its plates is doubled, what will be the new capacitance?
Answer:
\(\frac{C_{2}}{C_{1}}=\frac{d_{1}}{d_{2}}\)
∴ C2 = \(\frac{d_{1}}{d_{2}}\) × C1 = \(\frac{1}{2}\) × 12 = 6pF
is the new capacitance.
Question 69.
Explain the effect of a dielectric on the capacitance of a isolated charged parallel-plate capacitor.
Hence, show that if a dielectric of relative permit-tivity (dielectric constant) k completely fills the space between the plates, the capacitance increases by a factor k.
Answer:
Consider a parallel-plate capacitor without a dielectric, of plate area A, plate separation d and capacitance C0, charged to a potential difference V0 and then isolated.
Suppose the charges on its conducting plates are + Q and – Q, from figure (a). The surface density of free charge is
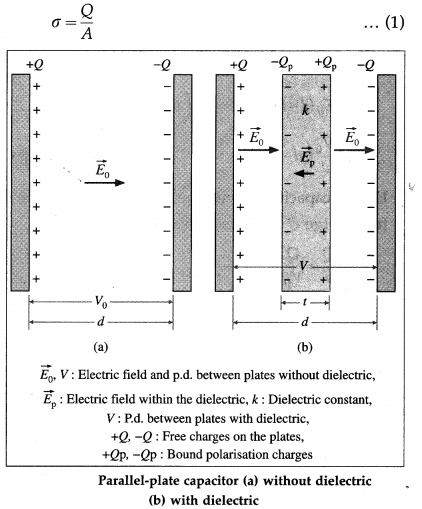
If A is very large and d is very small, the electric field in the region between the plates is almost uniform, except near the edges. The magnitude of the electric field intensity is
E0 = \(\frac{V_{0}}{d}=\frac{\sigma}{\varepsilon_{0}}=\frac{Q}{\varepsilon_{0} A}\)
Without the dielectric, the capacitance of the parallel plate capacitor is, by definition, C0 = \(\frac{Q}{V_{0}}=\frac{\varepsilon_{0} A}{d}\) ……………. (3)
Now, suppose a dielectric slab of permittivity e and thickness t (t < d) is introduced in the space between, and parallel to, the charged plates, from figure (b). A polarisation charge – Qp appears on the exterior surface of the dielectric nearer to the positive plate while a polarisation charge + Qp appears on its opposite face. Since the capacitor was isolated after charging, the free charge Q on the plates is the same as earlier. Within the dielectric, the induced field \(\vec{E}_{\mathrm{p}}\) due to the polarisation charges is opposite to the applied field. The net electric field within the dielectric \(\vec{E}\) is less than the applied field. In magnitude,
E = E0 – Ep …………. (4)
By definition, the relative permittivity (dielectric constant) of the dielectric, k = \(\frac{\varepsilon}{\varepsilon_{0}}=\frac{E_{0}}{E}\) ………. (5)
Between the plates, the field within the dielectric of thickness t is E = E0/k, and that in the region (d – t) is E0. Therefore, the new potential difference between the plates is
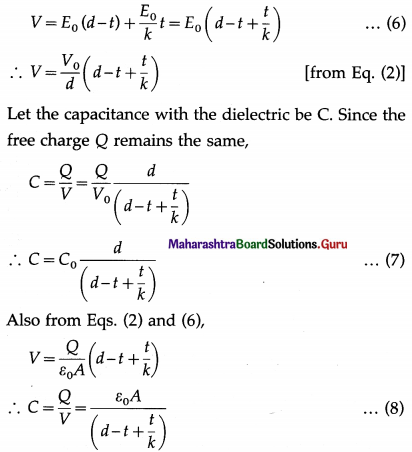
Equations (7) and (8) give the capacitance of a capacitor with a dielectric.
Special case: If the dielectric completely fills the space between the plates, t = d. Therefore, from Eq. (7),
C = C0 \(\frac{d}{\left(d-d+\frac{d}{k}\right)}\) = C0 \(\frac{d}{d / k}\) = kC0
Thus, the capacitance increases by the factor of k.
[Notes : (1) It‘is useful to check the other limits :
(i) As the thickness of the dielectric approaches zero, i.e., t → 0, we have C → ε0A/ d = C0, as expected for no dielectric.
(ii) If k = 1, we again have C = ε0A/d = C0, as expected for air or vacuum, capacitor where the dielectric is absent.
(2) The equation, V = \(\frac{V_{0}}{d}\) ( d – t + \(\frac{t}{k}\)), shows that V too is less than V0 for the same charge Q.
(3) Note that the configuration is equivalent to two capacitors of plate separations (d -1) and t connected in series, as shown in below figure. For capacitors connected in series, the equivalent capacitance is given by
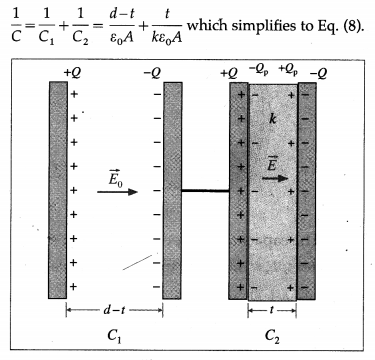
Thus, if the dielectric slab is replaced by a conducting slab of the same thickness f, the right-hand plates in above figure will be shorted and the equivalent capacitance C = C1 = \(\frac{\varepsilon_{0} A}{d-t}=\frac{d}{d-t}\) C0. Therefore, C > C0.
(4) If a battery supplying a potential difference V0 remains connected as a dielectric is inserted filling the space, the charge on the plates is increased by a factor k, the p.d. across the capacitor remaining constant Q = kQ0/ where Q0 is the charge on the plates without the dielectric. The capacitance becomes
C = \(\frac{Q}{V_{0}}=\frac{k Q_{0}}{V_{0}}\) = kC0
which is the same as in Eq. (9) where the charge remained constant, but now the charge has increased.]
Question 70.
State the expression for the capacitance of a parallel-plate capacitor filled with a dielectric. Explain how its capacitance can be increased.
Answer:
The capacitance of a parallel-plate capacitor filled with a dielectric is C = \(\frac{A k \varepsilon_{0}}{d}\)
where A is the area of each plate, k is the relative permittivity (dielectric constant) of the medium between the plates, ε0 is the permittivity of free space and d is the uniform plate separation.
The capacitance of a parallel-plate capacitor can be increased by
- increasing the area of each plate
- decreasing the distance between the two plates
- filling the space between the two plates by a medium of greater relative permittivity.
Question 71.
What are the functions of a dielectric in a capacitor?
Answer:
A dielectric material between the plates of a capacitor
- increases the capacitance of the capacitor
- provides mechanical support to the plates
- increases the maximum operating voltage, i.e., the maximum voltage to which the capacitor may be charged without breakdown of the insulating property of the medium between the plates.
Question 72.
A parallel-plate capacitor consists of n dielectric slabs of end-face areas A1, A2, ………, An and respective relative permittivities (dielectric constants) k1, k2, ….., kn, in the space between the plates as shown in below figure. Find the equivalent capacitance of this arrangement. Hence, show that if the areas are equal, the capacitance is C = \(\frac{\varepsilon_{0} A}{n d} \sum_{j} k_{j}\).
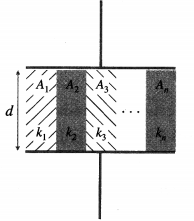
Answer:
Consider a parallel-plate capacitor without a dielectric, of plate area A, plate separation d and capacitance C0, charged to a potential difference V0 and then isolated. Without a dielectric, the capacitance of the parallel-plate capacitor is, by definition
C0 = \(\frac{Q}{V_{0}}=\frac{\varepsilon_{0} A}{d}\) …………… (1)
Now, suppose n dielectric slabs of end-face areas
A1, A1, …, A3 and respective relative permittivities
(dielectric constants) k1, k2, ………, kn fills the space between the plates as shown in above figure. The charge on the plates remaining the same, the reduced potential difference (V) between the plates is the same across each dielectric slab. Therefore, the capacitor is equivalent to a parallel combination of n capacitors of the same plate separation d but different plate areas and dielectric constants, as shown in below figure.
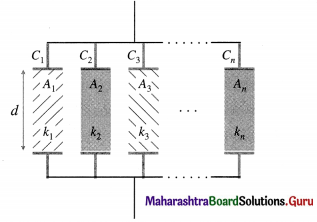
Then, C1 = k10A1/d, C2 = k2e0A2/d, … and so on.
Therefore, their equivalent capacitance is
C = C1 + C2 + ………… + Cn
= \(\frac{\varepsilon_{0}}{d}\)(k1A1 + k2A2 + …….. + knAn) ………… (2)
If the dielectric slabs have equal thickness such that their end-face areas are equal, i.e., A1 = A2 = …….. = An = A/n.
C = \(\frac{\varepsilon_{0} A}{n d}\)(k1 + k2 + ………… + kn) = \(\frac{\varepsilon_{0} A}{n d}\) Σj K\(\frac{\varepsilon_{0} A}{n d}\)
Question 73.
A dielectric of relative permittivity (dielectric constant) k completely fills the space between the plates of a parallel-plate capacitor with a surface charge density σ. Show that the induced density of surface charge on the dielectric is σp = σ (1 – \(\frac{1}{k}\))
Answer:
Consider a parallel-plate capacitor without a dielectric, of plate area A, plate separation d and capacitance C0, charged to a potential difference V and then isolated.
Suppose the charges on its conducting plates are +Q and -Q, from figure (a). The surface density of free charge is
σ = \(\frac{Q}{A}\) …………. (1)
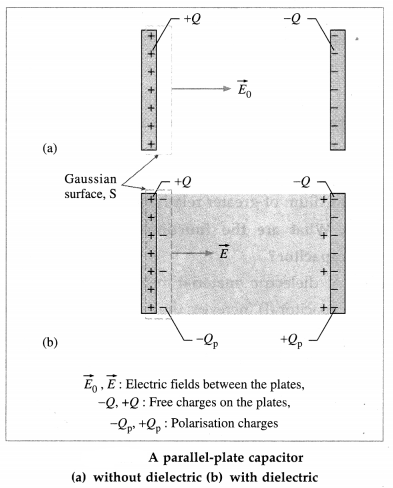
When no dielectric is present, the electric field \(\overrightarrow{E_{0}}\) in the region between the plates can be found by applying Gauss’s law to the Gaussian surface :
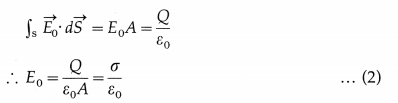
When a dielectric is inserted as in figure (b), there is an induced charge – Q, on the surface, and . the net charge enclosed by the Gaussian surface is Q – Qp. Then, by Gauss’s law,
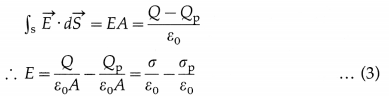
The effect of the dielectric is to weaken the original field E0 by a factor k.
Writing E = \(\frac{E_{0}}{k}\),
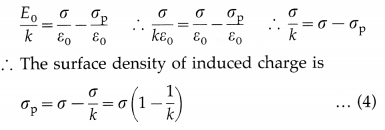
Question 74.
The capacitance of a parallel-plate air capacitor is 2 pF. If the air is replaced by a medium of dielectric constant 10. What will be its capacitance?
Answer:
\(\frac{C_{2}}{C_{1}}=\frac{k_{2}}{k_{1}}\)
C2 = \(\frac{k_{2}}{k_{1}}\) × C1 = \(\frac{10}{1}\) × 2 = 20 pF
is the required capacitance.
Question 75.
Explain the concept of displacement current.
Answer:
Consider an uncharged parallel-plate capacitor with capacitance C connected to a resistor R and a battery of voltage V, below figure. For a parallel-plate capacitor, of plate area A, separation d and filled with a dielectric of permittivity ¡, its capacitance is C = εA/d.
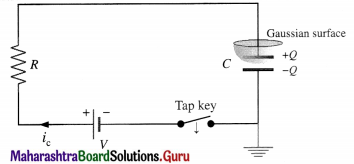
When the key is closed, charge begins to flow into the capacitor via the resistor. The initial voltage across the capacitor is zero and the current in the circuit now is called the charging current. As the capacitor charges up, the potential difference across its plates slowly increases. During the charging, the charge on the capacitor grows as Q(t) = Q(1 – e -t/T).
While a capacitor is being charged, there is no current through the capacitor but the electric field between the plates, and the electric flux through a Gaussian surface enclosing one of the plates, increases as the charge on its plates increases. The instantaneous charge on the capacitor is
Q(t) = (εA)E(f) [ε = kε0]
∴ \(\frac{d}{d t}\) Q(t) = (εA)\(\frac{d}{d t}\)E(t) = ε\(\frac{d}{d t}\)Φe(t)
where Φe(t) = AE(t) is the electric flux through the surface. The rate of change of charge, \(\frac{d}{d t}\) Q(t), has the
dimension of current and is the conduction current ic. The fictitious current arising from the changing electric flux is called the displacement current:
id = ε\(\frac{d}{d t}\)Φe(t)
That is, we imagine the changing flux through the dielectric is somehow equivalent to the conduction current in the circuit. This lets us generalize Kirchhoff’s junction rule : considering the top plate of the capacitor in the figure, when we include the displacement current, we see that the conduction current coming in from top and an equal displacement current coming out of the bottom. With this generalized meaning of the term “current”, we speak of current going through the capacitor.
Maxwell introduced the concept of displacement current to generalize Ampere’s law in his formulation of electromagnetic theory that led to the discovery of electromagnetic waves.
[Notes : (1) The lowercase i is used to denote instantaneous value of current. (2) The actual time taken for the charge on the capacitor to reach 63% of its maximum possible voltage is known as one time constant (T = RC). For all practical purposes, a capacitor is considered to be fully charged to Q after a time t = 5T. (3) In the pheno-menon of electromagnetic induction (Chapter 12), we see that a changing magnetic field gives rise to an induced electric field. Remarkably, it turns out that a changing electric field gives rise to a magnetic field – an example of the symmetry in nature. These two effects together explain the existence of all types of electromagnetic waves.]
Question 76.
Show that the energy of a charged capacitor is \(\frac{1}{2}\) CV2. Also, express this in other forms.
OR
Derive an expression for the energy stored in a charged capacitor. Express it in different forms.
Answer:
To charge a capacitor, an external agent has to do work against the electrostatic forces due to the charges already present on the plates of the capacitor.
Let C be the capacitance of the capacitor. Let Q and V be the final charge and the potential difference respectively when the capacitor is charged. Let q be the charge on the capacitor at some stage during the charging and v, the corresponding potential difference between the plates. The work done by an external agent in bringing additional small charge dq from infinity and depositing it on the capacitor is
dW = potential difference × charge = v dq
But C = \(\frac{q}{v}\) ∴ v = \(\frac{q}{C}\)
∴ dW = \(\frac{q}{C}\) dq
The total work done in charging the capacitor is
W = \(\int d W=\int_{0}^{Q} \frac{q d q}{C}=\frac{1}{C}\left[\frac{q^{2}}{2}\right]_{0}^{Q}=\frac{1}{2} \frac{Q^{2}}{C}\)
Now, Q = CV
W = \(\frac{1}{2}\)CV2 = \(\frac{1}{2}\)(CV)V = \(\frac{1}{2}\) QV
This work is stored in the form of potential energy, in the electric field in the medium between the plates of the capacitor.
∴ Energy of a charged capacitor
= \(\frac{1}{2} \frac{Q^{2}}{C}=\frac{1}{2} C V^{2}=\frac{1}{2} Q V\)
Question 77.
How does the energy stored in a charged capacitor change if the plates of the capacitor are moved farther apart
(i) after the battery is disconnected
(ii) the battery remaining connected?
Answer:
(i) If the plates of a charged capacitor are moved farther apart after the battery is disconnected, the energy stored increases by the amount of work done by the external agent in pulling the plates apart against the force of attraction between the opposite charges on the plates.
(ii) With the battery still connected, increasing the separation between the plates decreases the energy stored in the charged capacitor.
[Notes : (1) The charge on the capacitor does not change after the battery is disconnected. Because the electric field of a large plate is independent of the distance from the plate, the electric field \(\vec{E}\) between the plates also remains the same. Therefore, since E = V/d, the p.d. between the plates (V) changes in the same proportion as d. Since the energy stored,
U = \(\frac{1}{2} C V^{2}=\frac{1}{2}\left(\frac{A \varepsilon}{d}\right)(E d)^{2}=\frac{1}{2}(A \varepsilon D) E^{2}\)
U also changes in the same proportion as d. The addi-tional energy is transferred to the system from the work done by the external agent.
(2) With the battery still connected, the p.d. between the plates remains the same. Since the energy stored,
U = \(\frac{1}{2} C V^{2}=\frac{1}{2}\left(\frac{A \varepsilon}{d}\right) V^{2}\), U is inversely proportional to d. With decrease in capacitance, the charge on the plates decreases.]
Question 78.
When a capacitor is charged by a battery, is the energy stored in the capacitor the same as the energy supplied by the battery? Why?
Answer:
Yes. To charge a capacitor, an external agent (the battery) has to do work against the electrostatic force due to the charges already present on the plates of the capacitor. This work done is stored in the form of potential energy in the electric field in the medium between the plates of the capacitor.
Question 79.
If the charge on a capacitor is 2 µC and the potential difference across the conductors forming the capacitor is 100 V, what is the electrostatic energy stored in the capacitor?
Answer:
U = \(\frac{1}{2}\)QV = \(\frac{1}{2}\) × 2 × 10-6 C × 100V = 10-4 J
is the required energy.
Question 80.
The capacitance of a charged capacitor is C and the energy stored in it is U. What is the value of the charge on the capacitor ?
Answer:
Let Q be the charge on the capacitor. Then, the energy stored in it is
U = \(\frac{1}{2} \frac{Q^{2}}{C}\)
∴ Q = \(\sqrt{2 U C}\)
Question 81.
Which combination of four identical capacitors has the maximum capacitance? Which combination of these capacitors will store minimum energy when a constant p.d. is applied across it ?
Answer:
The maximum capacitance of four identical capacitors, each of capacitance C, is obtained for their parallel combination : Cp = 4C.
Their series combination has the minimum capacitance. The charge stored in their parallel combination is four times that in their series combination. For the same constant p.d. V, the energy stored in the parallel combination is \(\frac{1}{2}\) (4Q)V and that in the series combination is \(\frac{1}{2}\) QV. Thus, the series combination will store minimum energy.
82. Solve the following
Data : ε0 = 8.85 × 10⁻¹² F/m]
Question 1.
A 3 mm gap between the square metal plates of area 0.25 m2 that form a parallel plate capacitor is partly filled, as in figure (b), by a dielectric slab of the same shape and area, of thickness 2 mm and relative permittivity 2.5. Ignoring edge effects, calculate : .
(i) the capacitance when the dielectric slab covers the full area of the plates
(ii) the capacitance when the dielectric slab is partly withdrawn a distance x(x = 0.2 m) in a direction parallel to an edge of the plates.
Solution:
Data : d = 3mm = 3 × 10⁻³ m, A = l2 = 0.25m2, t = 2mm = 2 × 10⁻³ m, k = 2.5, x = 0.3m, ε0 = 8.85 × 10⁻¹² F/m
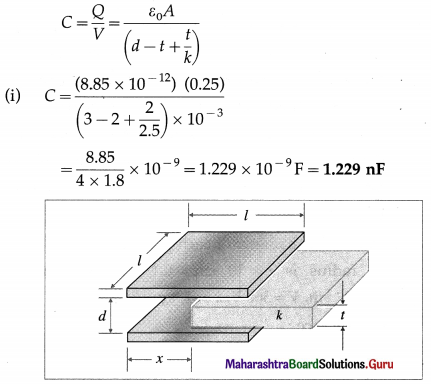
(ii) From below figure, the system is equivalent to a parallel combination of two capacitors : C, is air-filled with plate area A1 = lx and C2 has dielectric with plate area A2 = l (l – x).
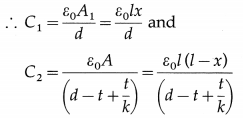
since l2 = 0.25 m2, Z = 0.5 m
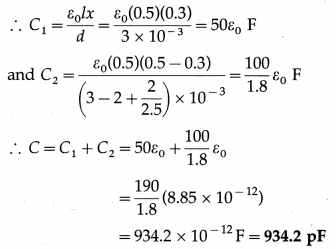
Question 2.
A parallel-plate air capacitor has an area 2 × 10⁻⁴ m2 and the separation between the two plates is 1 mm. Find its capacitance.
Solution:
Data : A = 2 × 10⁻⁴ m2, d = 1 mm = 10-3 m,
ε0 = 8.85 × 10⁻¹² C2/N.m2, k = 1 (for air)
The capacitance,
C = \(\frac{A k \varepsilon_{0}}{d}=\frac{\left(2 \times 10^{-4}\right)(1)\left(8.85 \times 10^{-12}\right)}{10^{-3}}\)
= 1.77 × 10⁻¹² F = 1.77 pF
Question 3.
A parallel-plate air capacitor has circular plates, each of diameter 20 cm, separated by a distance of 2 mm. The potential difference between the plates is maintained at 360 volts. Calculate its capacitance and charge. What is the intensity of the electric field between the plates of the capacitor? [k = 1]
Solution:
Data : The diameter of each plate is 20 cm. Hence, its radius is r = 10 cm = 0.1 m, d = 2 mm = 2 × 10⁻³ m, V = 360 V, k = 1, ε0 = 8.85 × 10⁻¹² F/m
(i) Capacitance :
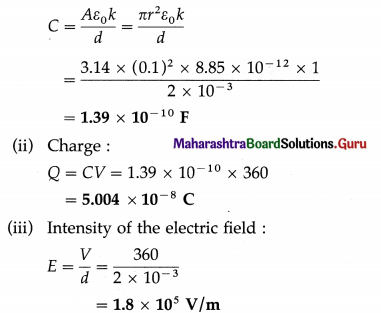
Question 4.
A parallel-plate air capacitor has rectangular plates, each of area 20 cm2 separated by a distance of 2 mm. The potential difference between the plates is 500 volts. Calculate (i) its capacitance (ii) the charge on each plate (iii) the electric field intensity between the two plates.
Solution:
Data : A = 20 cm2 = 20 × 10-4 m2 = 2 × 10⁻³ m2, k = 1, V = 500V, d = 2 mm = 2 × 10⁻³ m, ε0 = 8.85 × 10⁻¹² F/m
(i) Capacitance :
C = \(\frac{A \varepsilon_{0} k}{d}=\frac{\left(2 \times 10^{-3}\right)\left(8.85 \times 10^{-12}\right)(1)}{2 \times 10^{-3}}\)
= 8.85 × 10⁻¹² F ( = 8.85 pF)
(ii) Charge :
Q = CV = (8.85 × 10⁻¹²)(500)
= 4.425 × 10⁻⁹ C (= 4.425 nC)
(iii) Intensity of the electric field :
E = \(\frac{V}{d}=\frac{500}{2 \times 10^{-3}}\) = 2.5 × 10⁵ V/m
Question 5.
A parallel-plate air capacitor has rectangular plates each of length 20 cm and breadth 10 cm. The separation between the plates is 1 mm.
(a) Calculate the potential difference between the plates if 1 µC charge is given to the capacitor.
(b) With the same charge of 1 µC, if the separation between the plates is doubled, what is the new potential difference?
(c) Calculate the electric field between the plates.
Solution:
Data : Q = 1 nC = 10-9 C, l = 20 cm, b = 10 cm, d = 1 mm = 10-3 m, ε0 = 8.85 × 10⁻¹² F/m, k = 1 (air)
Area of the plates, A = lb = 20 × 10 = 200 cm2 = 0.02 m2
(a) The capacitance of the capacitor,
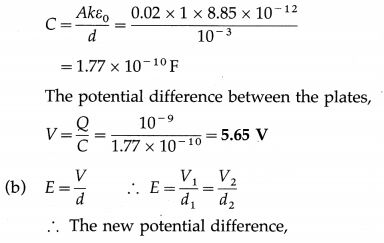
V2 = V1 × \(\frac{d_{2}}{d_{1}}\) = 5.65 × 2 = 11.3 V (∵\(\frac{d_{2}}{d_{1}}\) = 2, by the data )
(c) The electric field between the plates,
E = \(\frac{V}{d}=\frac{5.65}{10^{-3}}\) = 5650 N/C
Question 6.
A parallel-plate air capacitor has a capacity (capacitance) of 20 µF. What will be its new capacity if
(i) the distance between the plates is doubled
(ii) a marble slab of dielectric constant 8 is introduced filling the entire space between the two plates?
Solution:
Data : C1 = 20 µF, d2 = 2d1, k1 = 1 (air), k2 = 8 (marble)
C = \(\frac{A k \varepsilon_{0}}{d}\)
(i) With air as the dielectric,
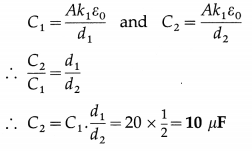
This gives the new capacity (capacitance) on doubling the plate separation.
(ii) With the plate separation d = d1,
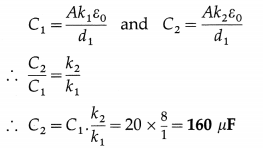
This gives the new capacity (capacitance) with marble as the dielectric.
Question 7.
A parallel-plate air capacitor of plate separation 2 mm and capacitance 1 µF is charged to 200 V. A dielectric of relative permittivity 50 is now inserted so as to fill the space between the plates.
(i) Find the new value of capacitance.
(ii) Find the polarisation charge on one of the boundaries of the dielectric.
(iii) Find the magnitude of the polarisation of the dielectric.
(iv) What is the magnitude of the electric field inside the dielectric?
Solution:
Data : C0 = 10-6 F, d = 2 × 10⁻³ m, k = 50, V = 200 V, ε0 = 8.85 × 10⁻¹² F/m
(i) The new value of the capacitance is
C = kC0 = 50 × 10-6 F (or 50µF)
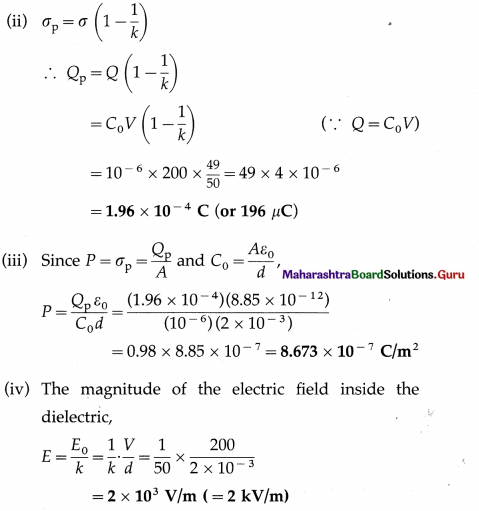
Question 8.
A parallel-plate capacitor consists of two identical metal plates. Two dielectric slabs having dielectric constants (relative permittivities) k1 and k2 are introduced in the space between the plates as shown in figures. Show that the capacity (capacitance) of the capacitor in figure (a) is given by C’ = \(\frac{A \varepsilon_{0}\left(k_{1}+k_{2}\right)}{2 d}\) and that in figure (a) is given by C” = \(\frac{2 A \varepsilon_{0}}{d} \cdot \frac{k_{1} k_{2}}{k_{1}+k_{2}}\)
Solution:
(i) The capacitor in figure(a) is equivalent to a parallel combination of two capacitors of plate separation d and plate area A/2, with C1 filled with dielectric of relative permittivity k1 and C2 filled with dielectric of relative permittivity k2, as shown in figure (b).
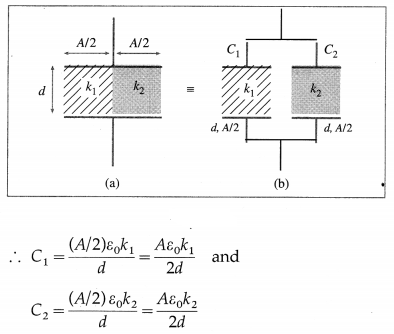
The equivalent capacitance of their parallel combination is
C’ = C1 + C2 = \(\frac{A \varepsilon_{0} k_{1}}{2 d}+\frac{A \varepsilon_{0} k_{2}}{2 d}=\frac{A \varepsilon_{0}\left(k_{1}+k_{2}\right)}{2 d}\) ……………. (1)
(ii) Suppose the capacitor in figure (a) is charged by connecting it to a battery. Let the potential of the positive plate a be Va, the potential of the negative plate c be Vc, and the potential midway between the plates at the interface b of the dielectrics be Vb.
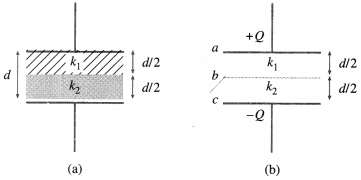
The electric field in the absence of any dielectric is
E0 = \(\frac{Q}{\varepsilon_{0} A}\)
The electric field in the first dielectric, E1 = \(\frac{E_{0}}{k_{1}}\)
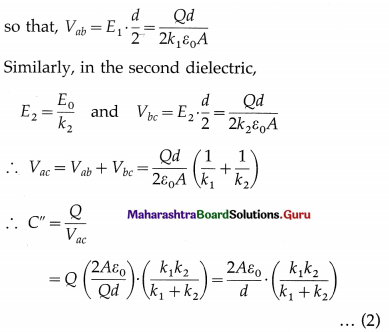
Equations (1) and (2) give the required expressions.
INote : The capacitor in figure (a) is equivalent to a series combination of two capacitors of plate separation d/2 and plate area A, with C3 filled with dielectric of relative permittivity k1 and C4 filled with dielectric of relative permittivity k2, as shown in below figure.]
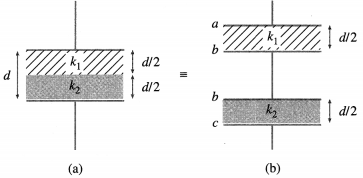
Question 9.
The energy stored in a charged capacitor of capa city 25 µF is 4J. Find the charge on its plate.
Solution:
Data: C = 25 pF = 25 × 10-12 F, U = 4 J
U = \(\frac{1}{2} \frac{Q^{2}}{C}\)
∴ The charge, Q = \(\sqrt{2 U C}\)
= \(\sqrt{2 \times 4 \times 25 \times 10^{-12}}\)
= 1.414 × 10⁻⁵ C (= 14.14 µC)
Question 10.
The electrostatic energy of 3.5 × 10⁻⁴ J is stored in a capacitor at 700 V. What is the charge on the capacitor?
Solution:
Data: U = 3.5 × 10⁻⁴ J, V = 700V
U = \(\frac{1}{2}\) QV
∴ Q = \(\frac{2 U}{V}=\frac{2 \times 3.5 \times 10^{-4}}{700}\) = 10-6 C
This is the charge on the capacitor.
Question 11.
Two capacitors, each of capacity 5 µF, and a battery of emf 180 V are given to you. Which combination gives the maximum energy? What is its value? Also find the charge on each capacitor of that combination.
Solution:
Data : C1 = C2 = 5 µF = 5 × 10⁻⁶ F, V = 180 V
(i) The effective capacity (Cp) of their parallel combination is
Cp = C1 + C1
= 5 × 10⁻⁶ F + 5 × 10⁻⁶ F
= 10 × 10-6F
Series combination :
(ii) The energy of a charged capacitor is U = \(\frac{1}{2}\) CV2
For a given value of V, the combination of maximum capacity will give maximum energy.
As Cp > Cs, the parallel combination gives maximum energy.
(iii) The value of maximum energy is
Umax = \(\frac{1}{2}\) CpV2 = \(\frac{1}{2}\) × 10 × 10-6 × (180)2
= 0.162 J
(iv) If Q1 and Q2 are the charges on C1 and C2,
Q1 = C1V= 5 × 10-6 × 180 = 9 × 10⁻⁴ C
Q2 = C2V = 5 × 10-6 × 180 = 9 × 10⁻⁴C
Question 83.
What is the Van de Graaff generator?
Answer:
The Van de Graaff generator is a high-voltage electrostatic generator that is used to produce very high potential differences of several million volts. It was constructed by US physicist Robert Van de Graaff in 1931. The high potential difference produced by the Van de Graaff generator is used to produce high-energy ion beams in a linear accelerator inside.
Question 84.
State the principle of working of the Van de Graaff generator. Describe its construction with a neat labelled diagram.
Answer:
Principle of working : The Van de Graaff generator works on the principles of corona or point discharge, that the charge on hollow conductor resides entirely on its outer surface and that the charge supplied to an insulated conductor increases its potential.
Construction : A hollow spherical conductor C is supported and insulated from the ground by a tower of ceramic insulators. A long, vertical, endless belt made of special insulating paper or fabric (rubberised silk) is continuously
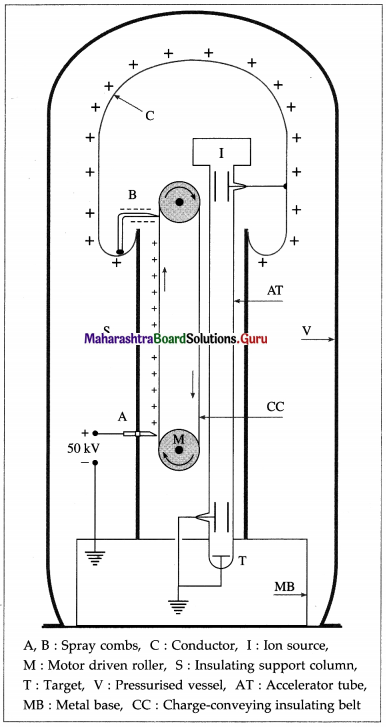
driven by an electric motor from the ground up to the inside of the conductor. Near the ground, the belt passes close to a spraycomb A which is connected to a high-voltage source. The spraycomb consists of a set of sharp needle points. Another spraycomb collector B is connected inside conductor C at the top. The entire apparatus is usually enclosed in a pressurized vessel containing a gas such as nitrogen or Freon.
Housed inside the assembly is an evacuated tube through which positively charged particles may be accelerated from a source at the same potential as the conductor C to a target at the ground potential.
Question 85.
Describe the working and uses of the Van de Graaff generator with a neat labelled diagram.
Answer:
Working : A high-voltage source, consisting of a high-voltage transformer rectifier circuit, is used to apply a potential difference of several thousand volts (about 50 kV to 100 kV) between spraycomb A and the ground. As a result of the high potential to spraycomb A, a continuous electric discharge takes place between comb A and the nonconducting belt that sprays electric charges onto the belt by corona or point discharge.
The moving belt carries this charge upward and transfers it to the hollow conductor. Collector comb B y inside the hollow conductor removes the charge from the belt by point discharge. Then, the charge flows to the outer surface of the hollow conductor where it accumulates as the process continues. The potential difference between the conductor and the Earth cumulatively increases until the energy density of the electric field builds up to such a high value that the insulating property of the surrounding gas breaks down and a corona discharge takes place through the surrounding gas between the conductor and the ground. If C is the capacitance of – the system and |Q| is the magnitude of the charge transferred from the ground to the conductor, the potential difference V between them is given by V = |Q|/C.
If the hollow conductor is well insulated from the Earth, the accumulated charge |Q| can be large enough and V can build up to several million volts. Since V is limited by the breakdown voltage of the surrounding medium, the entire apparatus is usually enclosed in a pressurized vessel containing a gas such as nitrogen or Freon. This raises the breakdown voltage considerably.
Positively charged particles may be accelerated in the evacuated tube from a source at the same potential as the dome conductor toward a target at the ground potential.
Uses : Machines equipped with positive ion sources and arranged for positive ion acceleration are widely used for research in nuclear structure and nuclear reactions, and for production of radioisotopes. Machines equipped with electron sources are used for X-ray therapy, industrial radiography, food and drug sterilization as well as research.
[Note : in a Van de Graaff single-stage accelerator, an ion source is located inside the high-voltage terminal (the dome conductor). Since the electric field inside a charged conductor is zero, the source must be at the same potential as the terminal. The ions are accelerated to the target (at the ground potential) by repulsion. Early quan-titative data on nuclear properties and processes came from Van de Graaff positive ion accelerators, which had a positive ion (proton, deuteron, alpha particle) source and the high voltage terminal raised to a high positive potential.
Van de Graaff electron accelerators had also been very successful as sources for X-rays for radiotherapy and industrial radiography. For an electrostatic electron accel-erator, the terminal is charged to a high negative potential and a thermionic cathode replaces the ion source. Accel-erated electrons impinging on watercooled gold targets provided for the first time high energy X-rays (~2 MeV) for cancer therapy. A number of such X-ray generators were developed by Prof. J. G. Trump and R.J. Van de Graaff which were installed in hospitals and industries. These instruments were about 3 ft in diameter and 6 ft long, and could be swung into any position to direct the X-ray beam.]
Multiple Choice Questions
Question 1.
Electric Intensity due to a charged sphere at a point outside the sphere dectea.ses with
(A) an increase in the charge on the sphere
(B) an increase in the dielectric constant
(C) a decrease m the distance from the centre of the sphere
(D) a decrease in the square of the distance from the centre of the sphere.
Answer:
(B) an increase in the dielectric constant
Question 2.
A charged spherical conductor in a medium of permittivity e basa surface charge density σ. At an outside point, a distance r from the centre of the conductor, the electric field intensity is
Answer:
(A) \(\frac{\sigma}{\varepsilon}\)
Question 3.
The electric field intensity in free space at a distance r outside a charged conducting sphere of radius R, in terms of its surface charge density e is
Answer:
(A) \(\frac{\sigma}{\varepsilon_{0}}\left(\frac{R}{r}\right)^{2}\)
Question 4.
If the radius of a sphere is doubled without chianging the charge on it then the electric flux originating from the sphere is
(A) double
(B) half
(C) the same
(D) zero.
Answer:
(C) the same
Question 5.
The intensity of electric field at a point clone but outside a charged conducting cylinder is proportional to
[r is the distance of the point from the axis of the cylinder]
(A) \(\frac{1}{r}\)
(B) \(\frac{1}{r^{2}}\)
(C) \(\frac{1}{r^{3}}\)
(D) r.
Answer:
(A) \(\frac{1}{r}\)
Question 6.
In the diagram, \(\vec{E}\) is a uniform electric field. Point B is to the west of point A while point C is to the east and point D is to the south. Which of the following is correct?
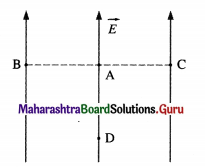
(A)VB > VA > VC
(B) VB < VA < VC
(C) VB = VC
(D) VD = VA
Answer:
(C) VB = VC
Question 7.
The figure shows three capacitors C1, C2 and C3. The dashed lines are equipotential surfaces within each capacitor. In which of the capacitors is the pd. between the two equipotentials ∆V = 50V?
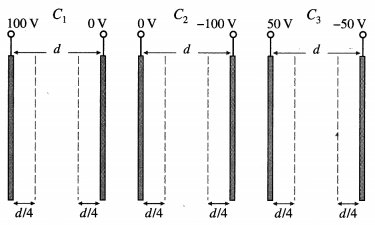
(A) Only in C1
(B) Only in C1 and C2
(C) Only in C3
(D) In all three capacitors
Answer:
(D) In all three capacitors
Question 8.
The potential energy of a dipole iii a uniform electric held \(\vec{E}\) is minimum when the dipole moment is
(A) transverse to \(\vec{E}\)
(B) parallel to \(\vec{E}\)
(C) antiparallel to \(\vec{E}\)
(D) either parallel or antiparallel to \(\vec{E}\).
Answer:
(B) parallel to \(\vec{E}\)
Question 9.
Which of the following molecules is nonpoLar?
(A) N2O
(B) H2O
(C) HCl
(D) CO2
Answer:
(D) CO2
Question 10.
A paralel-plate capacitor is charged by connecting it to a battery. The battery is then disconnected and the distance between the plates is doubled. This doubles
(A) the electric field at each point
(B) the charge density on each conductor
(C) the potential difference between the conductors
(D) the stored energy.
Answer:
(D) the stored energy.
Question 11.
A dielectric of relative permittivity k completely fills the space between the plates of a parallel.plate capacitor. When the surface charge density on the plates is σ, the polarization of the dielectric is
(A) σ (k – \(\frac{1}{k}\))
(B) \(\frac{\sigma}{k}\)
(C) σ (1 – \(\frac{1}{k}\))
(D) σ (k – 1)
Answer:
(C) σ (1 – \(\frac{1}{k}\))
Question 12.
If at a certain stage during the charging of a capacitor of capacitance C. the charge and potential difference are q and e, the work dW required to transfer an additional amount of charge dq is
(A) vdq
(B) \(\frac{d q}{v}\)
(C) \(\frac{v d q}{C}\)
(D) \(\frac{q^{2}}{2 C}\)
Answer:
(A) vdq
Question 13.
The energy density in the region between the plates of a charged parallel-plate air capacitor is given by the expression
(A) \(\frac{1}{2}\)ε0E2
(B) \(\frac{1}{2}\)ε0E
(C) \(\frac{E^{2}}{2 \varepsilon_{0}}\)
(D) \(\frac{\sigma^{2}}{\varepsilon_{0}}\)
Answer:
(A) \(\frac{1}{2}\)ε0E2
Question 14.
A 5 μF capacitor is charged to a p.d. of 10 V. If it is further charged, so that its p.d. increases to 20 V, the electric energy stored in it increases by
(A) 450 μJ
(B) 500 μJ
(C) 750 μJ
(D) 900 μJ
Answer:
(C) 750 μJ
Question 15.
A 5 pF capacitor is connected in series with a 10 μF capacitor and the combination is connected across a 9 V battery. The potential differences across the capacitors are in the ratio
(A) 4 : 1
(B) 3 : 1
(C) 2 : 1
(D) 1 : 1
Answer:
(C) 2 : 1
Question 16.
A 2 μF capacitor, charged to a p.d. of 200 V, is connected across an uncharged capacitor. If the common p.d. is 20 V, the capacitance of the second capacitor is
(A) 18 μF
(B) 20 μF
(C) 36 μF
(D) 40 μF
Answer:
(A) 18 μF
Question 17.
Three capacitors of capacitances 2 μF, 3 μF and 6 μF are connected in series. The equivalent capacitance of the combination is
(A) 0.5 μF
(B) 1 μF
(C) 1.1 μF
(D) 11 μF
Answer:
(B) 1 μF
Question 18.
Two capacitors each of capacitance 4 μF are connected in series, and a third capacitor of capacitance 4 μF is connected in parallel with the combination. Then, the equivalent capacitance of the arrangement is
(A) 12 μF
(B) 8 μF
(C) 6 μF
(D) 2.65 μF
Answer:
(C) 6 μF
Question 19.
A parallel-plate air capacitor of a plate area A and plate separation d has capacitance C0. A dielectric of thickness d, width A/2 and relative permittivity k, is inserted between the plates as shown. The capacitance of the capacitor is
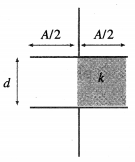
(A) 2(k + 1) C0
(B) (k + 1 )C0
(C) kC0
(D) \(\frac{k+1}{2}\) C0
Answer:
(D) \(\frac{k+1}{2}\) C0
Question 20.
The resultant capacitance between the points A and B in the figure below is
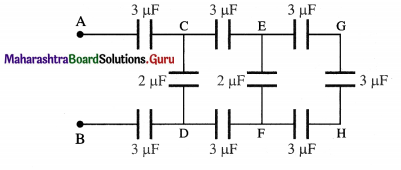
(A) 1 μF
(B) 1.5 μF
(C) 2 μF
(D) 3 μF.
Answer:
(A) 1 μF
Question 21.
Two parallel plates, separated by a distance d, are kept at potential difference V volt. A charge q of mass m enters between the parallel plates with some velocity. The acceleration of the charged particle will be
(A) \(\frac{q V}{d m}\)
(B) \(\frac{d m}{q V}\)
(C) \(\frac{q m}{d V}\)
(D)\(\frac{d V}{q m}\)
Answer:
(A) \(\frac{q V}{d m}\)
Question 22.
The capacitance of an isolated spherical conductor of radius R in vacuum is
(A) not defined
(B) zero
(C) 4πε0R
(D) infinite.
Answer:
(C) 4πε0R
Question 23.
Three parallel plates, each of area A, form a capacitor. The separation between the first and second plates is d1 and that between the second and third is d2. The gaps are completely filled with dielectrics of dielectric constant k1 and k2, respectively. The capacitance of this capacitor is
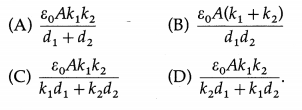
Answer:
(D) \(\frac{\varepsilon_{0} A k_{1} k_{2}}{k_{2} d_{1}+k_{1} d_{2}}\)
Question 24.
A parallel-plate capacitor, of plate area A and plate separation d, is filled with dielectrics of dielectric constants k1, k2 and k3, as shown
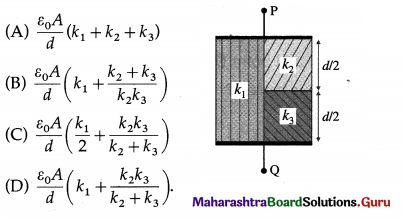
Answer:
(C) \(\frac{\varepsilon_{0} A}{d}\left(\frac{k_{1}}{2}+\frac{k_{2} k_{3}}{k_{2}+k_{3}}\right)\)
Question 25.
With three 6 μF capacitors, which of the capacitance values are available to you ?
(A) 2 μF and 18 μF
(B) 2 μF, 9 μF, 12 μF and 18 μF
(C) 2 μF, 9 μF and 18 μF
(D) 2 μF, 6 μF, 9 μF, 12 μF and 18 μF
Answer:
(D) 2 μF, 6 μF, 9 μF, 12 μF and 18 μF
Question 26.
A capacitor of plate separation 0.02 mm is completely filled with a dielectric material of strength 20 kV/mm. The maximum voltage rating of the capacitor is
(A) 100 V
(B) 200 V
(C) 400 V
(D) 800 V
Answer:
(C) 400 V
Question 27.
Three capacitors C1, C2 and C3 are connected to a battery of p.d. V as shown. Which of the following are the correct relations for the charges on the capacitors and the p.d.s across them ?
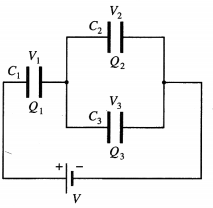
(A) Q1 = Q1 = Q3 andV1 = V2 = V3 = V
(B) Q1 = Q2 + Q3 and V = V1 + V2 + V3
(C) Q1 = Q2 + Q3 and V= V1 + V2
(D) Q2 – Q3 and V2 = V3
Answer:
(C) Q1 = Q2 + Q3 and V= V1 + V2
Question 28.
A copper plate of thickness b is inserted between the plates of a parallel-plate capacitor of plate separation d. If b = d/3, the capacitances before and after the insertion of the plate are in the ratio
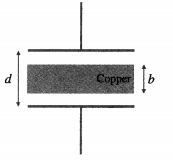
(A) 2 : 3
(B) 3 : 2
(C) 1 : \(\sqrt {3}\)
(D) \(\sqrt {3}\) : 1.
Answer:
(A) 2 : 3
Question 29.
The energy stored in a charged capacitor is U. The capacitor is isolated and connected across the terminals of an identical uncharged capacitor. The energy stored in each capacitor is
(A) U
(B) 3U/4
(C) U/2
(D) U/4
Answer:
(D) U/4
Question 30.
An uncharged parallel-plate capacitor filled with a material of dielectric constant k is connected to a parallel-plate air capacitor of identical geometry charged to a potential V. At equilibrium, common potential difference across them is V’. The dielectric constant k is equal to V’-V
Answer:
Question 31.
Two parallel capacitors of capacitances C and 2C are connected in parallel and charged to a potential V. The battery is then disconnected and the space between the plates of the first capacitor is filled with a material of dielectric constant k. The potential difference across the capacitors is
(A) \(\frac{3 V}{k}\)
(B) \(\frac{3 V}{k+2}\)
(C) \(\frac{3 V}{3k+2}\)
(D) \(\frac{4 V}{2k+3}\)
Answer: