Balbharti Maharashtra State Board Class 10 Maths Solutions covers the Practice Set 6.1 Geometry 10th Class Maths Part 2 Answers Solutions Chapter 6 Trigonometry.
10th Standard Maths 2 Practice Set 6.1 Chapter 6 Trigonometry Textbook Answers Maharashtra Board
Class 10 Maths Part 2 Practice Set 6.1 Chapter 6 Trigonometry Questions With Answers Maharashtra Board
Question 1.
If sin θ = \(\frac { 7 }{ 25 } \), find the values of cos θ and tan θ.
Solution:
sin θ = \(\frac { 7 }{ 25 } \) … [Given]
We know that,
sin2 θ + cos2 θ = 1
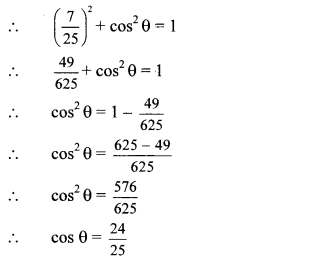
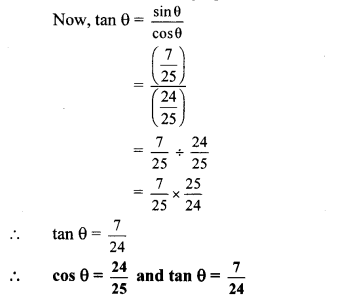
…[Taking square root of both sides] Now, tan θ = \(\frac{\sin \theta}{\cos \theta}\)
Alternate Method:
sin θ = \(\frac { 7 }{ 25 } \) …(i) [Given]
Consider ∆ABC, where ∠ABC 90° and ∠ACB = θ.
sin θ = \(\frac { AB }{ AC } \) … (ii) [By definition]
∴ \(\frac { AB }{ AC } \) = \(\frac { 7 }{ 25 } \) … [From (i) and (ii)]
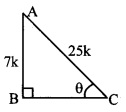
LetAB = 7k and AC = 25k
In ∆ABC, ∠B = 90°
∴ AB2 + BC2 = AC2 … [Pythagoras theorem]
∴ (7k)2 + BC2 = (25k)2
∴ 49k2 + BC2 = 625k2
∴ BC2 = 625k2 – 49k2
∴ BC2 = 576k2
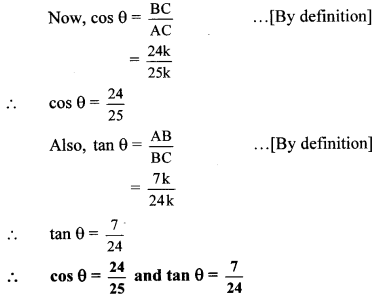
∴ BC = 24k …[Taking square root of both sides]
Question 2.
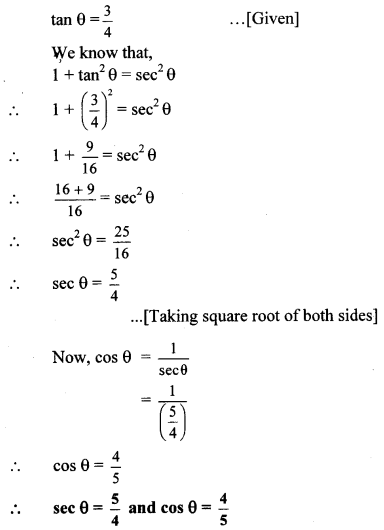
If tan θ = \(\frac { 3 }{ 4 } \), find the values of sec θ and cos θ.
Solution:
Alternate Method:
tan θ = \(\frac { 3 }{ 4 } \) …(i)[Given]
Consider ∆ABC, where ∠ABC 90° and ∠ACB = θ.
tan θ = \(\frac { AB }{ BC } \) … (ii) [By definition]
∴ \(\frac { AB }{ BC } \) = \(\frac { 3 }{ 4 } \) … [From (i) and (ii)]
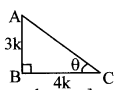
Let AB = 3k and BC 4k
In ∆ABC,∠B = 90°
∴ AB2 + BC2 = AC2 …[Pythagoras theorem]
∴ (3k)2 + (4k)2 = AC2
∴ 9k2 + 16k2 = AC2
∴ AC2 = 25k2
∴ AC = 5k …[Taking square root of both sides]
Question 3.
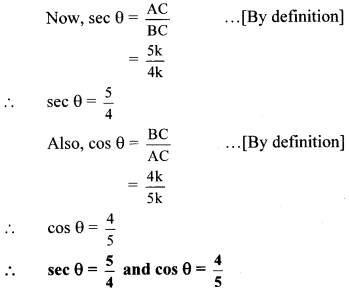
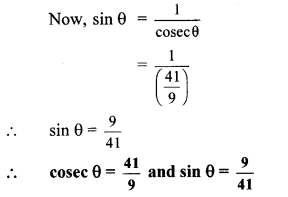
If cot θ = \(\frac { 40 }{ 9 } \), find the values of cosec θ and sin θ
Solution:
..[Taking square root of both sides]
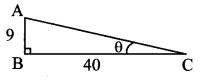
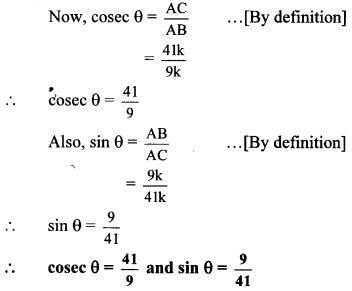
Alternate Method:
cot θ = \(\frac { 40 }{ 9 } \) ….(i) [Given]
Consider ∆ABC, where ∠ABC = 90° and
∠ACB = θ
cot θ = \(\frac { BC }{ AB } \) …(ii) [By defnition]
∴ \(\frac { BC }{ AB } \) = \(\frac { 40 }{ 9 } \) ….. [From (i) and (ii)]
Let BC = 40k and AB = 9k
In ∆ABC, ∠B = 90°
∴ AB2 + BC2 = AC2 … [Pythagoras theorem]
∴ (9k)2 + (40k)2 = AC2
∴ 81k2 + 1600k2 = AC2
∴ AC2 = 1681k2
∴ AC = 41k … [Taking square root of both sides]
Question 4.
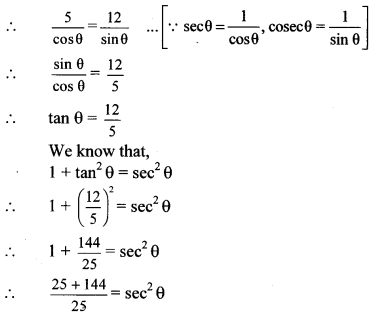
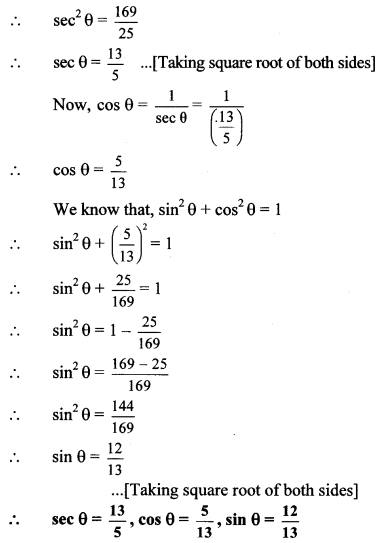
If 5 sec θ – 12 cosec θ = θ, find the values of sec θ, cos θ and sin θ.
Solution:
5 sec θ – 12 cosec θ = 0 …[Given]
∴ 5 sec θ = 12 cosec θ
Question 5.
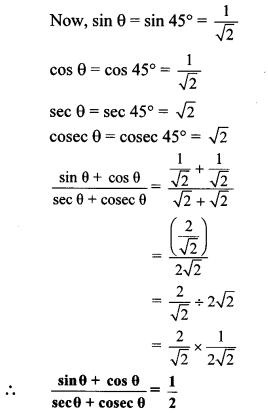
If tan θ = 1, then find the value of
![]()
Solution:
tan θ = 1 … [Given]
We know that, tan 45° = 1
∴ tan θ = tan 45°
∴ θ = 45°
Question 6.
Prove that:
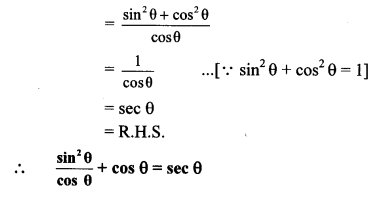
i. \(\frac{\sin ^{2} \theta}{\cos \theta}+\cos \theta=\sec \theta\)
ii. cos2 θ (1+ tan2 θ) = 1
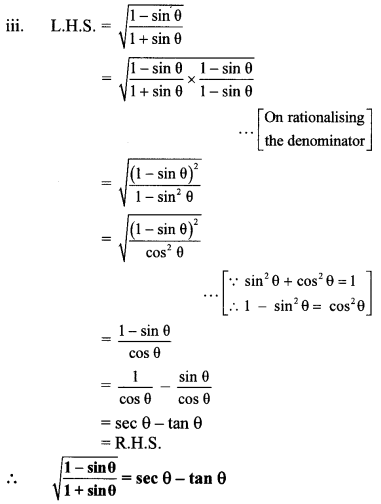
iii. \(\sqrt{\frac{1-\sin \theta}{1+\sin \theta}}=\sec \theta-\tan \theta\)
iv. (sec θ – cos θ) (cot θ + tan θ) tan θ. sec θ
v. cot θ + tan θ cosec θ. sec θ
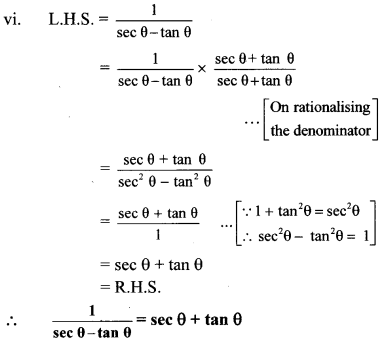
vi. \(\frac{1}{\sec \theta-\tan \theta}=\sec \theta+\tan \theta\)
vii. sin4 θ – cos4 θ = 1 – 2 cos2 θ
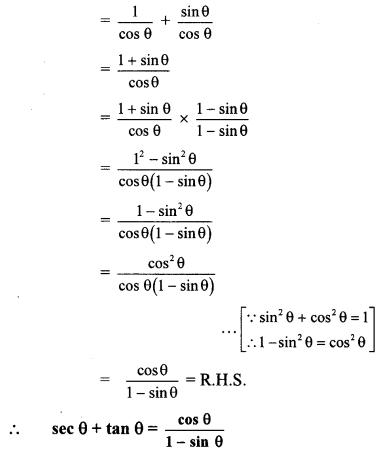
viii. \(\sec \theta+\tan \theta=\frac{\cos \theta}{1-\sin \theta}\)
Proof:
i. L.H.S. = \(\frac{\sin ^{2} \theta}{\cos \theta}+\cos \theta\)
ii. L.H.S. = cos2 θ(1 + tan2 θ)
= cos2 θ sec2 θ …[∵ 1 + tan2 θ = sec2 θ]
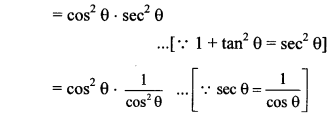
= 1
= R.H.S.
∴ cos2 θ (1 + tan2 θ) = 1
iv. L.H.S. = (sec θ – cos θ) (cot θ + tan θ)
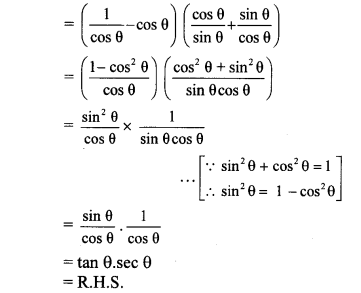
∴ (sec θ – cos θ) (cot θ + tan θ) = tan θ. sec θ
v. L.H.S. = cot θ + tan θ
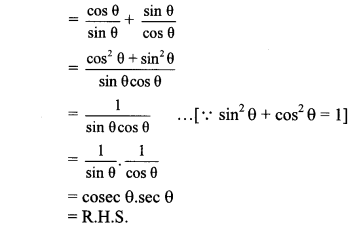
∴ cot θ + tan θ = cosec θ.sec θ
vii. L.H.S. = sin4 θ – cos4 θ
= (sin2 θ)2 – (cos2 θ)2
= (sin2 θ + cos2 θ) (sin2 θ – cos2 θ)
= (1) (sin2 θ – cos2 θ) ….[∵ sin2 θ + cos2 θ = 1]
= sin2 θ – cos2 θ
= (1 – cos2 θ) – cos2 θ …[θ sin2 θ = 1 – cos2 θ]
= 1 – 2 cos2 θ
= R.H.S.
∴ sin4 θ – cos4 θ = 1 – 2 cos2 θ
viii. L.H.S. = sec θ + tan θ
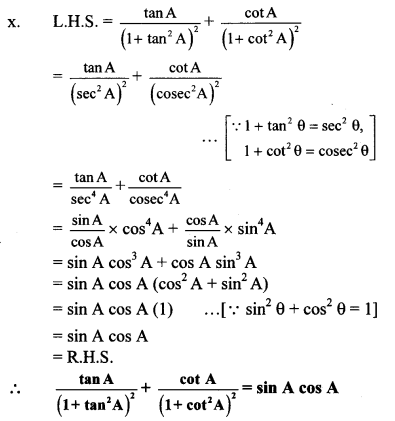
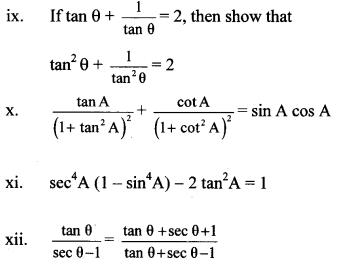
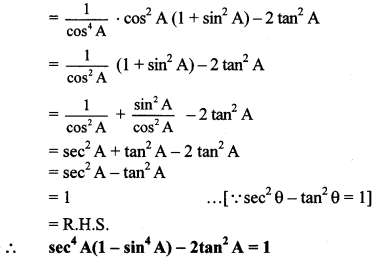
xi. L.H.S. = sec4 A (1 – sin4 A) – 2 tan2 A
= sec4 A [12 – (sin2 A)2] – 2 tan2 A
= sec4 A (1 – sin2A) (1 + sin2 A) – 2 tan2 A
= sec4 A cos2A (1 + sin2 A) – 2 tan2A
[ ∵ sin2 θ + cos2 θ = 1 ,∵ 1 – sin2 θ = cos2 θ]
Maharashtra Board Class 10 Maths Chapter 6 Trigonometry Intext Questions and Activities
Question 1.
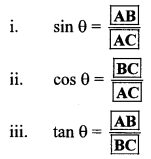
Fill in the blanks with reference to the figure given below. (Textbook pg. no. 124)
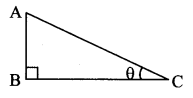
Solution:
Question 2.
Complete the relations in ratios given below. (Textbook pg, no. 124)
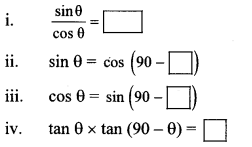
Solution:
i. \(\frac{\sin \theta}{\cos \theta}\) = [tan θ]
ii. sin θ = cos (90 – θ)
iii. cos θ = (90 – θ)
iv. tan θ × tan (90 – θ) = 1
Question 3.
Complete the equation. (Textbook pg. no, 124)
sin2 θ + cos2 θ = [______]
Solution:
sin2 θ + cos2 θ = [1]
Question 4.
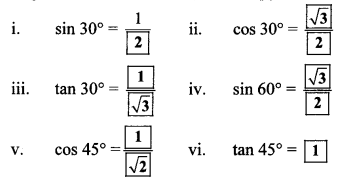
Write the values of the following trigonometric ratios. (Textbook pg. no. 124)
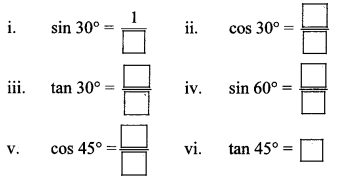
Solution:
Maharashtra Board Class 10 Maths Solutions
Class 10 Maths Digest