Balbharti Maharashtra State Board Class 9 Maths Solutions covers the Practice Set 7.5 Algebra 9th Class Maths Part 1 Answers Solutions Chapter 7 Statistics.
9th Standard Maths 1 Practice Set 7.5 Chapter 7 Statistics Textbook Answers Maharashtra Board
Class 9 Maths Part 1 Practice Set 7.5 Chapter 7 Statistics Questions With Answers Maharashtra Board
Question 1.
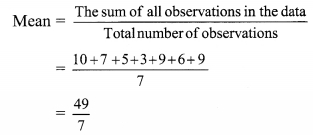
Yield of soyabean per acre in quintal in Mukund’s field for 7 years was 10, 7, 5,3, 9, 6, 9. Find the mean of yield per acre.
Solution:

Mean = 7
The mean of yield per acre is 7 quintals.
Question 2.
Find the median of the observations, 59, 75, 68, 70, 74, 75, 80.
Solution:
Given data in ascending order:
59, 68, 70, 74, 75, 75, 80
∴ Number of observations(n) = 7 (i.e., odd)
∴ Median is the middle most observation
Here, 4th number is at the middle position, which is = 74
∴ The median of the given data is 74.
Question 3.
The marks (out of 100) obtained by 7 students in Mathematics examination are given below. Find the mode for these marks.
99, 100, 95, 100, 100, 60, 90
Solution:
Given data in ascending order:
60, 90, 95, 99, 100, 100, 100
Here, the observation repeated maximum number of times = 100
∴ The mode of the given data is 100.
Question 4.
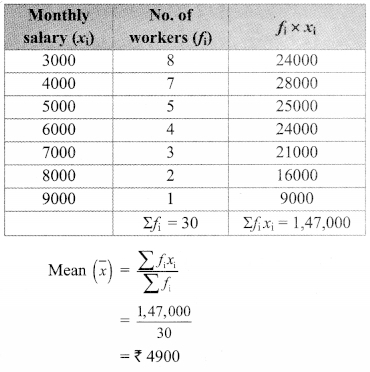
The monthly salaries in rupees of 30 workers in a factory are given below.
5000, 7000, 3000, 4000, 4000, 3000, 3000,
3000, 8000, 4000, 4000, 9000, 3000, 5000,
5000, 4000, 4000, 3000, 5000, 5000, 6000,
8000, 3000, 3000, 6000, 7000, 7000, 6000,
6000, 4000
From the above data find the mean of monthly salary.
Solution:

∴ The mean of monthly salary is ₹ 4900.
Question 5.
In a basket there are 10 tomatoes. The weight of each of these tomatoes in grams is as follows:
60, 70, 90, 95, 50, 65, 70, 80, 85, 95.
Find the median of the weights of tomatoes.
Solution:
Given data in ascending order:
50, 60, 65, 70, 70, 80 85, 90, 95, 95
∴ Number of observations (n) = 10 (i.e., even)
∴ Median is the average of middle two observations
Here, 5th and 6th numbers are in the middle position
∴ Median = \(\frac { 70+80 }{ 2 }\)
∴ Median = \(\frac { 150 }{ 2 }\)
∴ The median of the weights of tomatoes is 75 grams.
Question 6.
A hockey player has scored following number of goals in 9 matches: 5, 4, 0, 2, 2, 4, 4, 3,3.
Find the mean, median and mode of the data.
Solution:
i. Given data: 5, 4, 0, 2, 2, 4, 4, 3, 3.
Total number of observations = 9
![]()

∴ The mean of the given data is 3.
ii. Given data in ascending order:
0,2, 2, 3, 3, 4, 4, 4,5
∴ Number of observations(n) = 9 (i.e., odd)
∴ Median is the middle most observation
Here, the 5th number is at the middle position, which is 3.
∴ The median of the given data is 3.
iii. Given data in ascending order:
0,2, 2, 3, 3, 4, 4, 4,5
Here, the observation repeated maximum number of times = 4
∴ The mode of the given data is 4.
Question 7.
The calculated mean of 50 observations was 80. It was later discovered that observation 19 was recorded by mistake as 91. What Was the correct mean?
Solution:
Here, mean = 80, number of observations = 50
\( \text { Mean }=\frac{\text { The sum of all observations }}{\text { Total number of observations }}\)
∴ The sum of all observations = Mean x Total number of observations
∴ The sum of 50 observations = 80 x 50
= 4000
One of the observation was 19. However, by mistake it was recorded as 91.
Sum of observations after correction = sum of 50 observation + correct observation – incorrect observation
= 4000 + 19 – 91
= 3928
∴ Corrected mean

= 78.56
∴ The corrected mean is 78.56.
Question 8.
Following 10 observations are arranged in ascending order as follows. 2, 3 , 5 , 9, x + 1, x + 3, 14, 16, 19, 20. If the median of the data is 11, find the value of x.
Solution:
Given data in ascending order :
2, 3, 5, 9, x + 1, x + 3, 14, 16, 19, 20.
∴ Number if observations (n) = 10 (i.e., even)
∴ Median is the average of middle two observations
Here, the 5th and 6th numbers are in the middle position.
∴ \( \text { Median }=\frac{(x+1)+(x+3)}{2}\)
∴ 11 = \(\frac { 2x+4 }{ 2 }\)
∴ 22 = 2x + 4
∴ 22 – 4 = 2x
∴ 18 = 2x
∴ x = 9
Question 9.
The mean of 35 observations is 20, out of which mean of first 18 observations is 15 and mean of last 18 observations is 25. Find the 18th observation.
Solution:
\( \text { Mean }=\frac{\text { The sum of all observations }}{\text { Total number of observations }}\)
∴ The sum of all observations
= Mean x Total number of observations
The mean of 35 observations is 20
∴ Sum of 35 observations = 20 x 35 = 700 ,..(i)
The mean of first 18 observations is 15
Sum of first 18 observations =15 x 18
= 270 …(ii)
The mean of last 18 observations is 25 Sum of last 18 observations = 25 x 18
= 450 …(iii)
∴ 18th observation = (Sum of first 18 observations + Sum of last 18 observations) – (Sum of 35 observations)
= (270 + 450) – (700) … [From (i), (ii) and (iii)]
= 720 – 700 = 20
The 18th observation is 20.
Question 10.
The mean of 5 observations is 50. One of the observations was removed from the data, hence the mean became 45. Find the observation which was removed.
Solution:
\( \text { Mean }=\frac{\text { The sum of all observations }}{\text { Total number of observations }}\)
∴ The sum of all observations = Mean x Total number of observations
The mean of 5 observations is 50
Sum of 5 observations = 50 x 5 = 250 …(i)
One observation was removed and mean of remaining data is 45.
Total number of observations after removing one observation = 5 – 1 = 4
Now, mean of 4 observations is 45.
∴ Sum of 4 observations = 45 x 4 = 180 …(ii)
∴ Observation which was removed
= Sum of 5 observations – Sum of 4 observations = 250 – 180 … [From (i) and (ii)]
= 70
∴ The observation which was removed is 70.
Question 11.
There are 40 students in a class, out of them 15 are boys. The mean of marks obtained by boys is 33 and that for girls is 35. Find out the mean of all students in the class.
Solution:
Total number of students = 40
Number of boys =15
∴ Number of girls = 40 – 15 = 25
The mean of marks obtained by 15 boys is 33
Here, sum of the marks obtained by boys
= 33 x 15
= 495 …(i)
The mean of marks obtained by 25 girls is 35 Sum of the marks obtained by girls = 35 x 25
= 875 …(ii)
Sum of the marks obtained by boys and girls = 495 + 875 … [From (i) and (ii)]
= 1370
∴ Mean of all the students

= 34.25
∴ The mean of all the students in the class is 34.25.
Question 12.
The weights of 10 students (in kg) are given below:
40, 35, 42, 43, 37, 35, 37, 37, 42, 37. Find the mode of the data.
Solution:
Given data in ascending order:
35, 35, 37, 37, 37, 37, 40, 42, 42, 43
∴ The observation repeated maximum number of times = 37
∴ Mode of the given data is 37 kg
Question 13.
In the following table, the information is given about the number of families and the siblings in the families less than 14 years of age. Find the mode of the data.

Solution:
Here, the maximum frequency is 25.
Since, Mode = observations having maximum frequency
∴ The mode of the given data is 2.
Question 14.
Find the mode of the following data.

Solution:
Here, the maximum frequency is 9.
Since, Mode = observations having maximum frequency
But, this is the frequency of two observations.
∴ Mode = 35 and 37
Maharashtra Board Class 9 Maths Chapter 7 Statistics Practice Set 7.5 Intext Questions and Activities
Question 1.
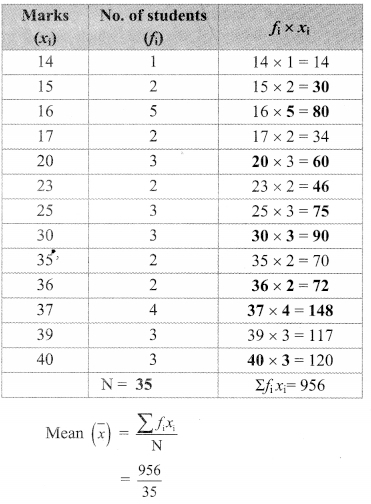
The first unit test of 40 marks was conducted for a class of 35 students. The marks obtained by the students were as follows. Find the mean of the marks.
40, 35, 30, 25, 23, 20, 14, 15, 16, 20, 17, 37, 37, 20, 36, 16, 30, 25, 25, 36, 37, 39, 39, 40, 15, 16, 17, 30, 16, 39, 40, 35, 37, 23, 16.
(Textbook pg, no. 123)
Solution:
Here, we can add all observations, but it will be a tedious job. It is easy to make frequency distribution table to calculate mean.

= 27.31 marks (approximately)
∴ The mean of the mark is 27.31.
Class 9 Maths Digest